

Applications
 Part of the Oxford Instruments Group
Expand
Collapse
Part of the Oxford Instruments Group

Application Notes
Published: 02 Jan 2019 · Last updated: 02 Jan 2019
Tags: EBSD
Microanalysis is a powerful tool in understanding potential failure mechanisms and potential life time of many materials. In this example, the microstructure and damage distribution following creep deformation of a nickel superalloy is studied using electron backscatter diffraction (EBSD) and energy dispersive spectrometry (EDS).
Oxford Instruments AZtecSynergy system is used to acquire both the EBSD and EDS data and to study deformation in the sample. The EBSD data was collected using the NordlysNano detector which is optimised for collecting high quality, distortion free EBSPs; the EDS data was collected with an X-MaxN150 large area SDD detector.
In this example some additional data processing is achieved using an additional third party software package, BLG CrossCourt 3, which processes EBSD patterns using a cross-correlation technique to measure residual strain. This package uses the raw, unprocessed EBSPs saved as TIFF files during the acquisition process. For this application, the high quality, distortion free patterns collected from the NordlysNano detector are essential.
Ni superalloys typically exhibit excellent mechanical strength and resistance to creep (the tendency for solids to deform under stress). These superalloys typically have a gamma (γ) matrix coupled with a gamma prime (γ') intermetallic phase Ni3(Al,Ti) which acts as a barrier to dislocation. The gamma prime phase is created by the chemical addition of materials such as aluminum and titanium. Creep resistance is dependent on slowing the speed of dislocations within the crystal structure. Under creep conditions the γ' particles tend to raft and deformation is largely at grain boundaries and the γ'/γ interface.
In this study, EBSD is used to investigate the microstructure and damage distribution that developed in the Inconel alloy IN 738 after creep deformation.
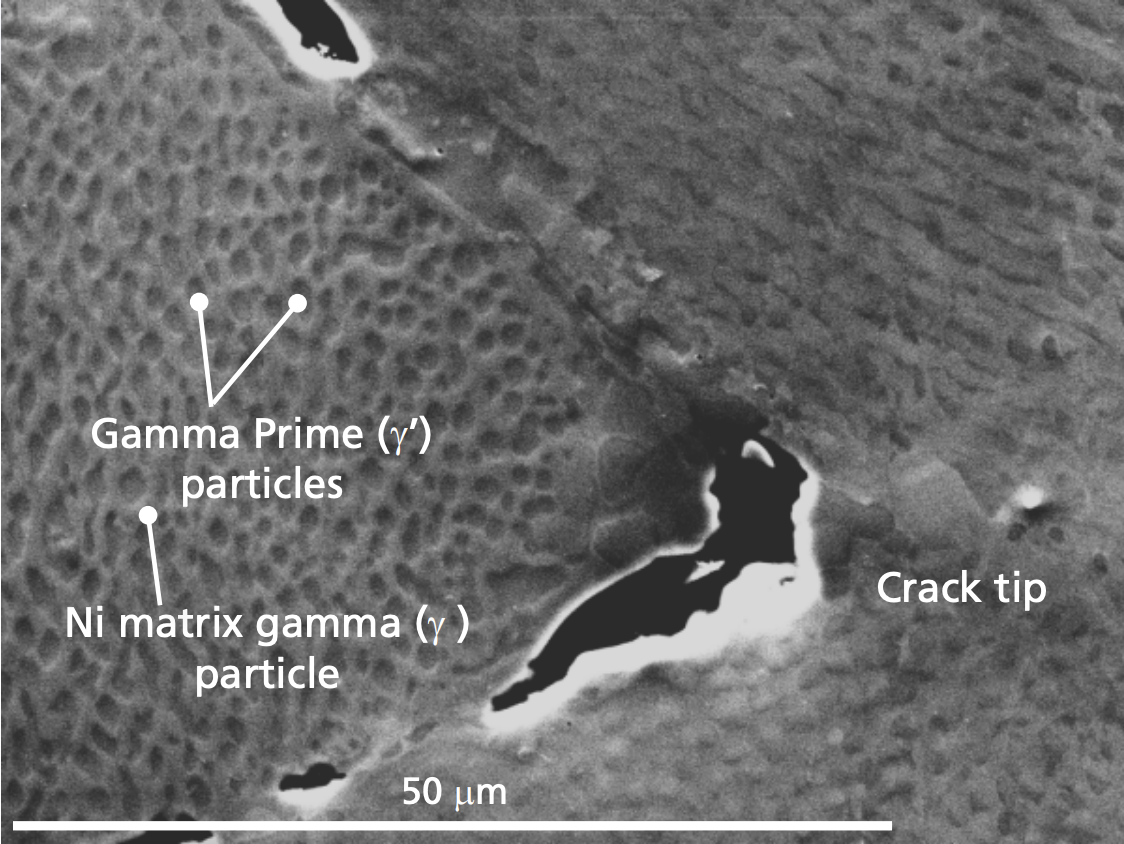
Fig. 1. Secondary Electron image of the Inconel 738 sample. Large gamma grains are visible and, within these, smaller gamma prime particles. In this area two crack tips are observed. In the grain above the lower crack tip the gamma prime particles appear to have rafted. There are also some larger particles around the crack tip.
A secondary electron image of the polished sample is shown in Figure 1. The microstructure is comprised of large grains containing gamma prime particles in a matrix of gamma.
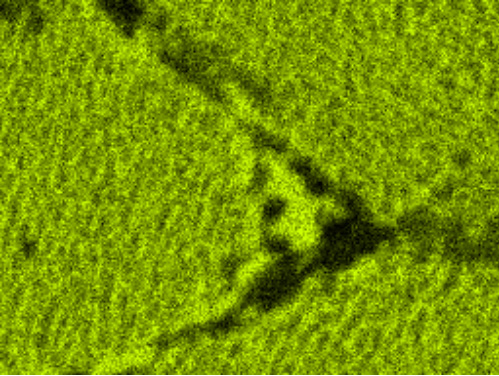
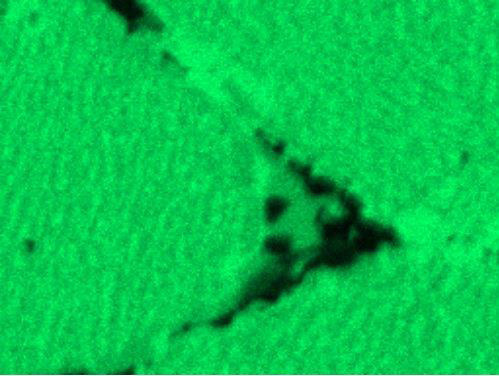
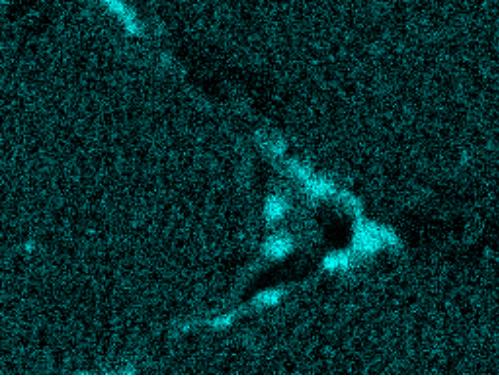
X-ray maps collected from the same area are shown in Figure 2 on the next page. These maps display the elemental distribution in the sample. The γ phase is rich in chromium while the g’ phase is richer in nickel, aluminium and titanium. The crack tip particles are carbides of chromium and molybdenum.
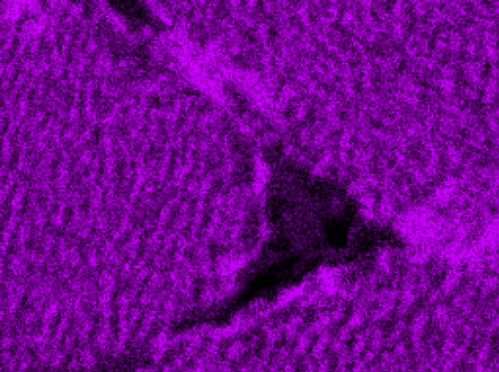
Al X-ray map.
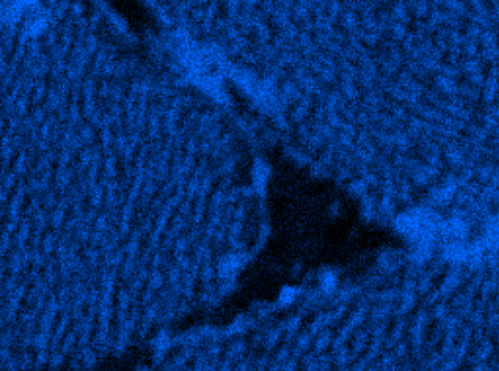
Ti X-ray map.
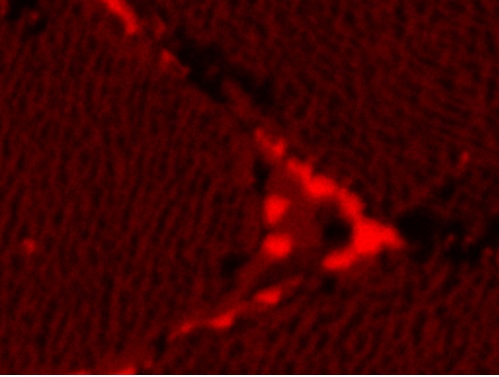
Cr X-ray map
Co X-ray map
Ni X-ray map.
Mo X-ray map.
Fig. 2. X-ray maps collected from the crack tip
The EBSD patterns, corresponding solutions and spectra from the three different phases: g, g’ and carbide particles are given in Figure 3 are shown below.
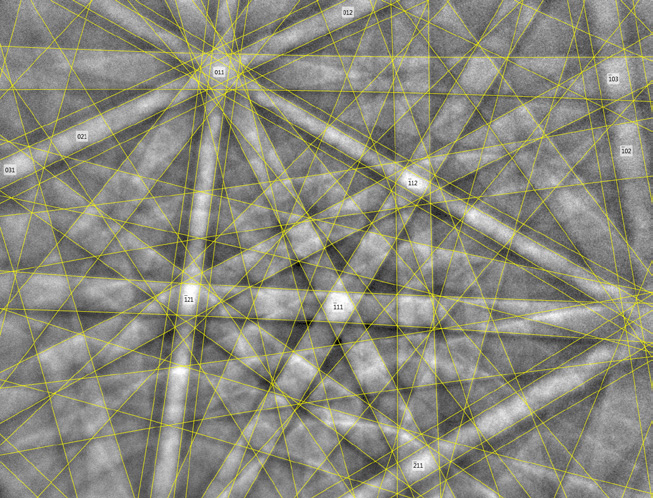
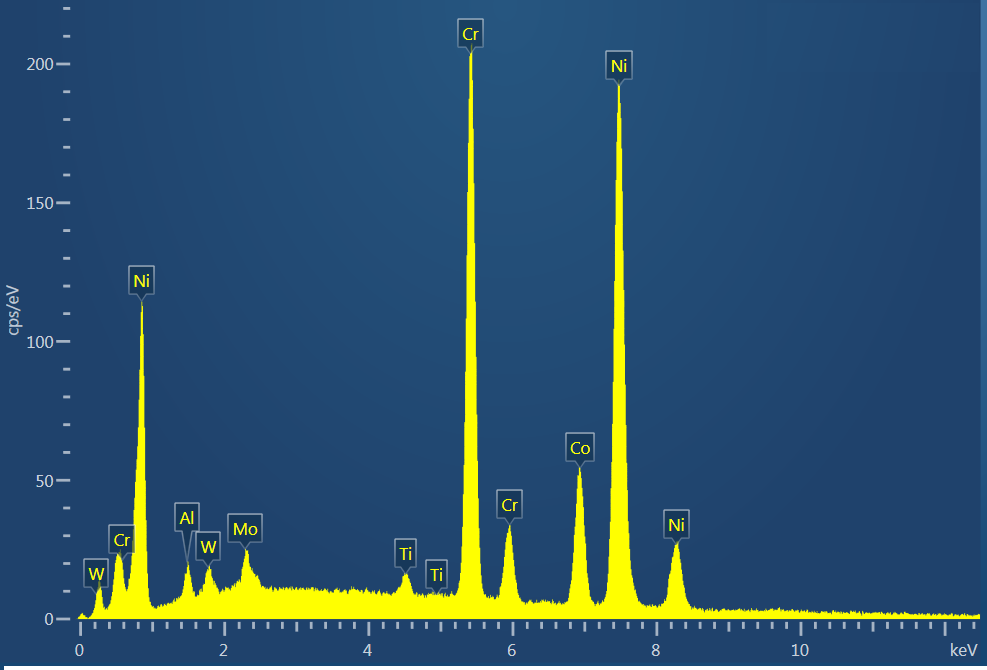
Fig. 3a. Ni gamma (g) phase.
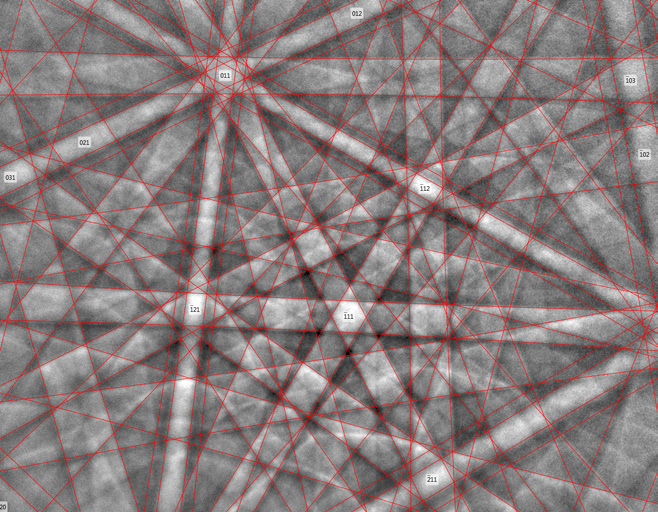
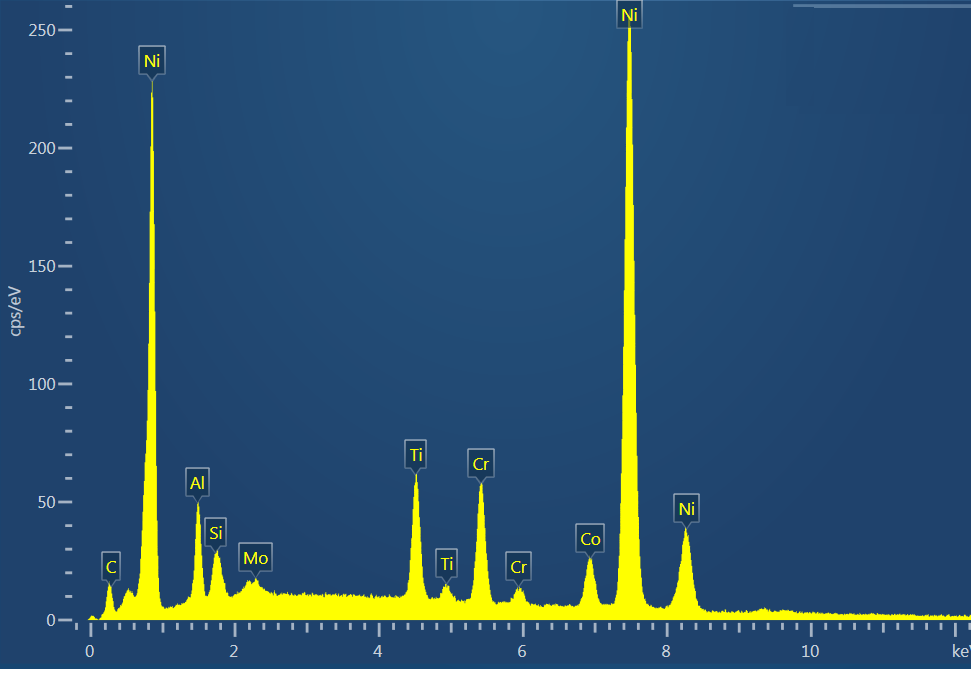
Fig. 3b. Ni3 AlTi gamma prime (g’) phase.
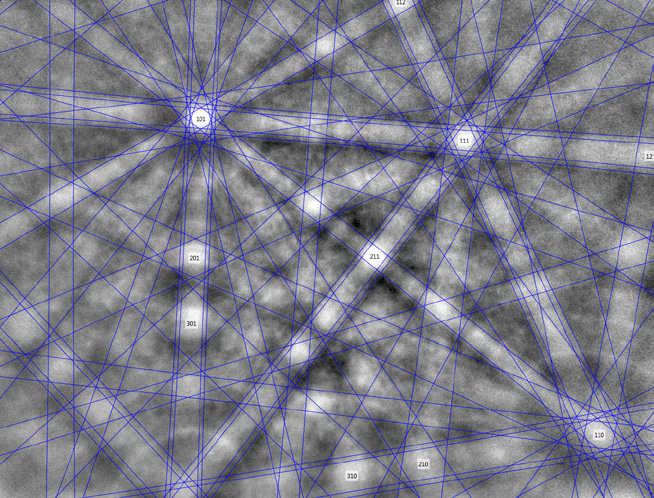
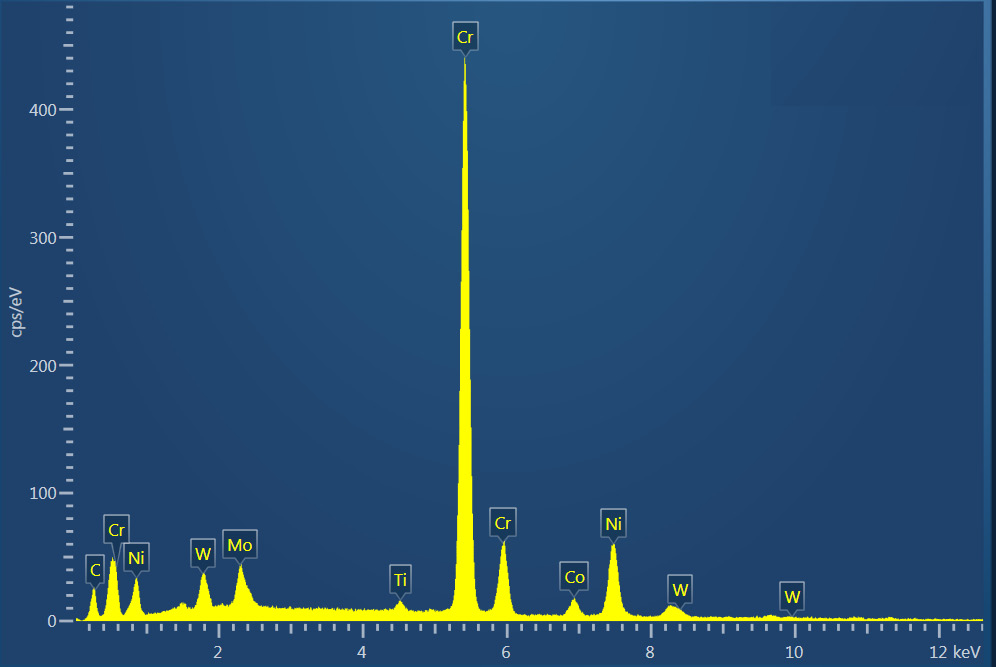
Fig. 3c. Carbide M23C6 boundary particles.
The γ' and γ phases have different composition but the same crystal structure (Table 1). Therefore both can be indexed with the fcc Ni phase, as shown in the EBSD maps below.
| Phase | Space group | Laue group | Lattice parameter a=b=c (nm) |
| Ni3AlTi (γ') | 225 | 11, m3m | 0.587 |
| Ni γ | 225 | 11, m3m | 0.357 |
| Carbide boundary particles | 225 | 11, m3m | 1.06 |
Table 1. Match Unit details for γ', Ni and carbides.
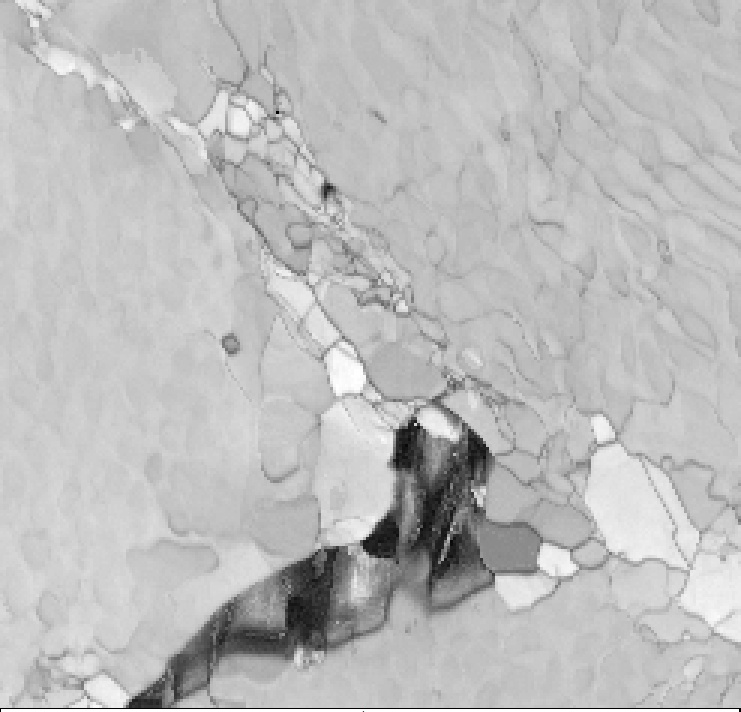
Fig. 4a. Pattern quality map.
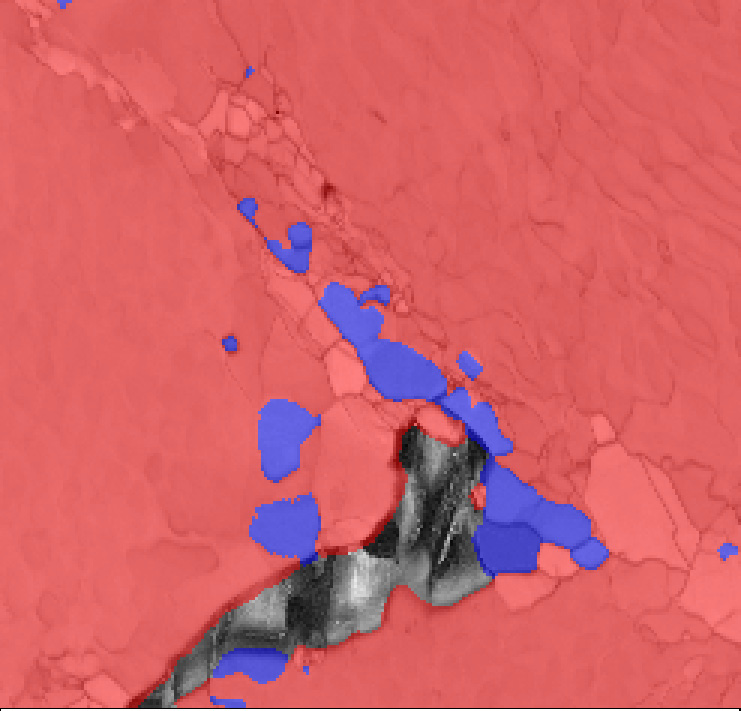
Fig. 4b. Phase Map red = g/ g’, Blue = M23C6 .
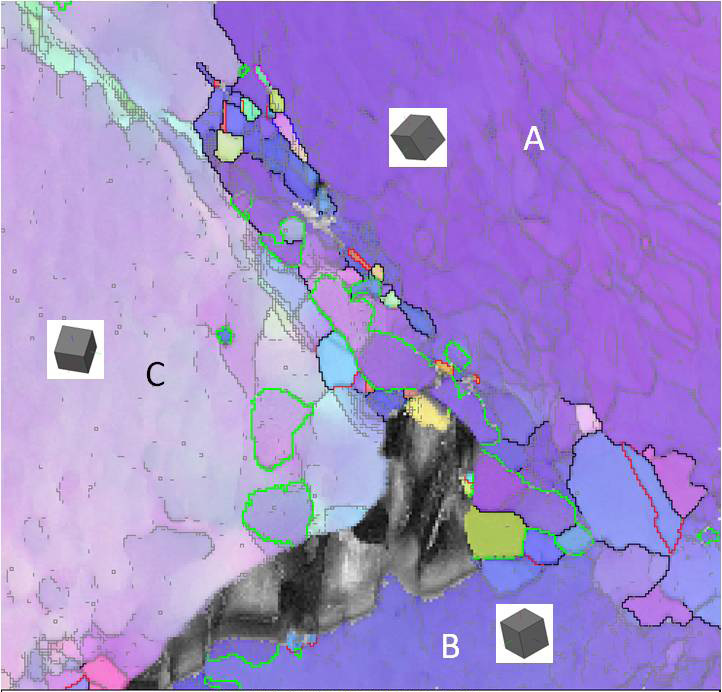
Fig. 4c. 3D crystal orientation of the grains A, B & C
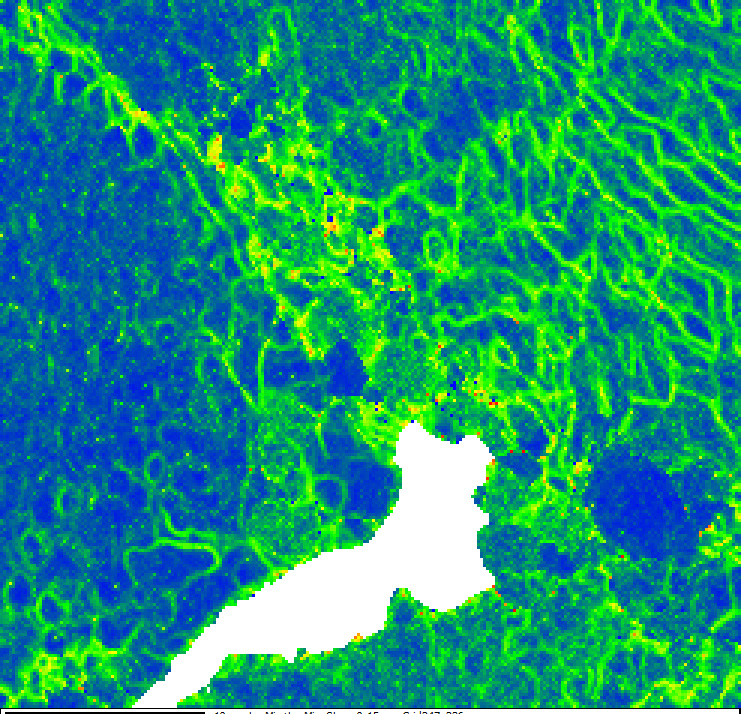
Fig. 4d. Local misorientation map
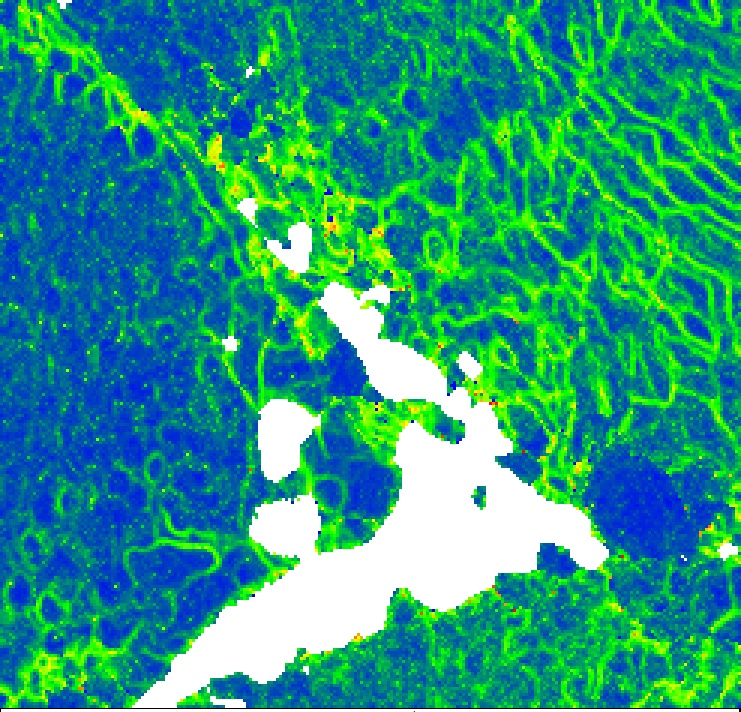
Fig. 4e. Local misorientation map for the g/g’ phase.
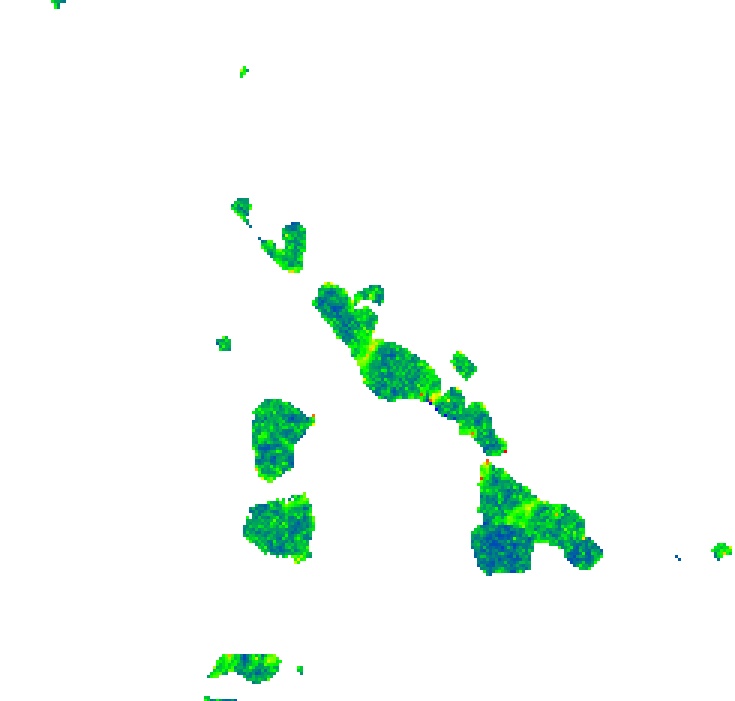
Fig. 4f. Local misorientation map for the M23C6 phase.
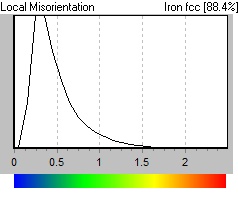
Fig. 4g. Colour key showing local misorientation for Figs. 4d, e, and f
The pattern quality map in Figure 4a shows the boundaries between the g and g’ phases and the rafting of the g’ phase. The local misorientation maps: Figures d, e and f, illustrate the misorientation that exists at the g phase grain boundaries and the interfaces between g/g’ phases. The higher degree of misorientation is shown by the bright green through yellow colour, shown on the key. The highest degree of misorientation measured (up to 2 degrees) is between the g’ particles in grain A, where the highest rafting is observed.
Further analysis of this data can be achieved by tracking subtle relative changes between the EBSPs. In this example, Crosscourt 3 (www.BLGVantage.com) was used to quantify these pattern distortions and calculate the full relative distortion matrix at each point of the scan. This analysis benefits from the export of the EBSPs as ‘raw’ unprocessed 12 bit TIFF images and from the high angular resolution and distortion free images collected using the NordlysNano.
Crosscourt 3 generates a large number of outputs, but in this example we only show the High Resolution Kernel Average Misorientation map (figure 5). In this case the patterns from grains A, B and C are processed (not the carbides and smaller grains). All grains show a complex pattern of deformation with the formation of sub cells of around 2 µm in size clearly visible.
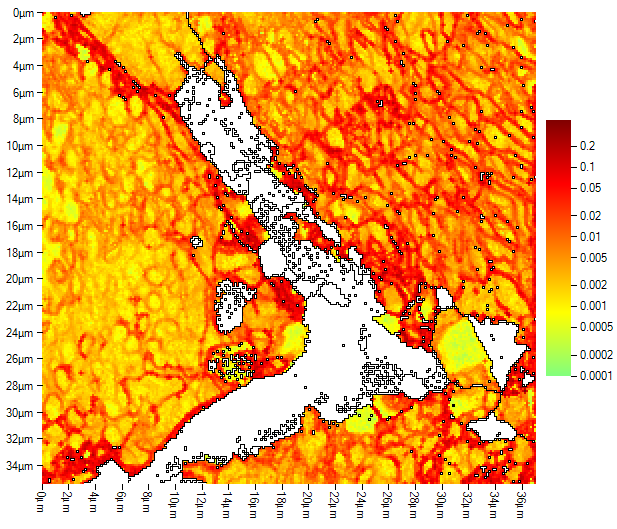
Fig. 5. HR Kernel Average Map output from CrossCourt3.
Acquiring EBSD with X-ray data in the SEM is a powerful tool to characterise materials to determine the distribution of creep damage. In this example the local misorientation maps visually show the extent and degree of creep damage between the phase interface, and especially where the sample shows rafting.
In addition, the raw EBSPs are suitable for analysis in third party cross-correlation packages and for these applications the collection of the highest quality EBSPs is essential.

© Oxford Instruments 2026