Part of the Oxford Instruments Group
Expand

Imaris for Tracking

Imaris for Tracking provides interactive processing, visualization and analysis software for 3D and 4D microscopic images. Featuring state of the art volume rendering, plus object detection and tracking tools Imaris for Tracking is perfect for researchers who want to automatically analyze moving objects including those that divide over time, create a lineage tree plot and generate quantitative information from their image data. It now includes ground breaking technology introduced in Imaris 9 to address the major bottleneck of today’s image analysis – effective quantification and Surface visualization of objects within datasets of hundreds of gigabytes.

Request Pricing/Free Trial Existing Customer - Satellite License

Object Detection & Tracking Motion in Real Conditions

Imaris for Tracking gives the choice of proven Imaris 3D tracking algorithms: Brownian Motion, Autoregresive Motion (Expert), Connected Components or Lineage to generate the most accurate tracking results for different types of moving objects. Users can automatically correct translational and rotational drift or track within the new freehand coordinate system (Reference Frame) or use the automated option for drift correction.

Motion

 
  • Automatically track objects of interest using one of the provided algorithms
  • Handle thousands of objects and time points
  • Represent trajectory or displacement using multiple visualization options
  • Calculate average and instantaneous speed, acceleration
  • Manually create and edit tracks

Tracking cell division and lineage

 
  • Use the provided lineage algorithm designed for tracking dividing cells and nuclei
  • Explore cell fate from one progenitor cell to the final generation
  • Automatically create an editable lineage tree
  • Mark selected lineage tree branches with colored labels and analyse your data per lineage
  • Calculate Cell Cycle Duration, Generation, Time Since First Division, Time Since Previous Division

Reference Frame

Cytoplasm, nucleus, nucleoli and various populations of vesicles can be detected and analyzed within a complete cell object.

 
  • Establishes a new coordinate system that can be used to standardize measurements amongst samples regardless their initial orientation.
  • Can be freely moved and rotated within the dataset frame; visible and fixed planes available
  • Set a Reference Frame on moving or rotating object to analyse motion of smaller objects inside, ie. Cells inside rotating embryo, vesicles inside moving cell, border cells inside egg chamber
  • Play time-lapse sequences in Reference Frame mode to align playback to it
  • Get statistics in standard and Reference Frame coordinate system

Statistics and measurements

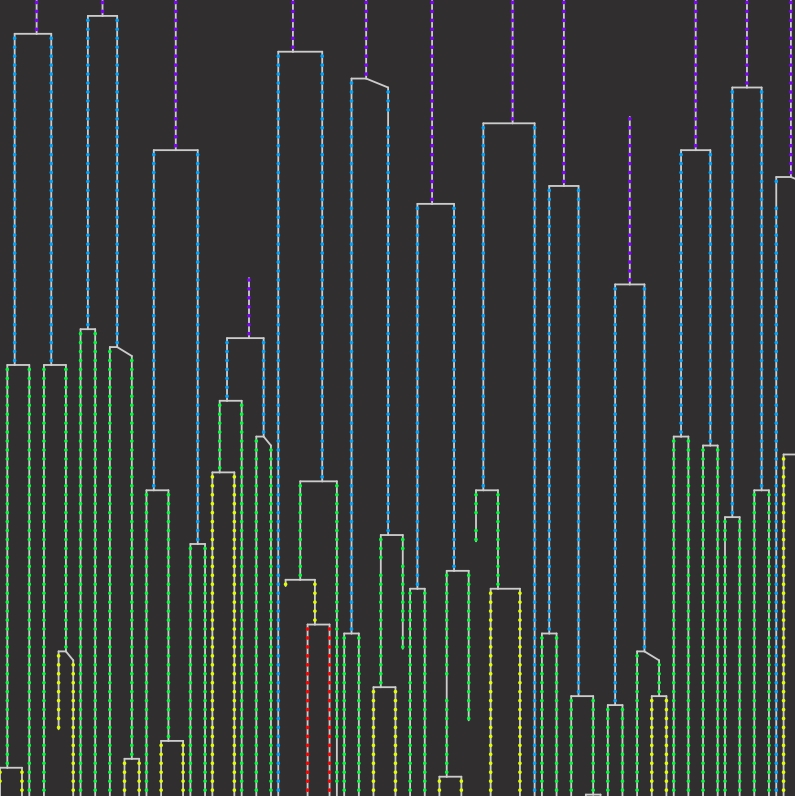
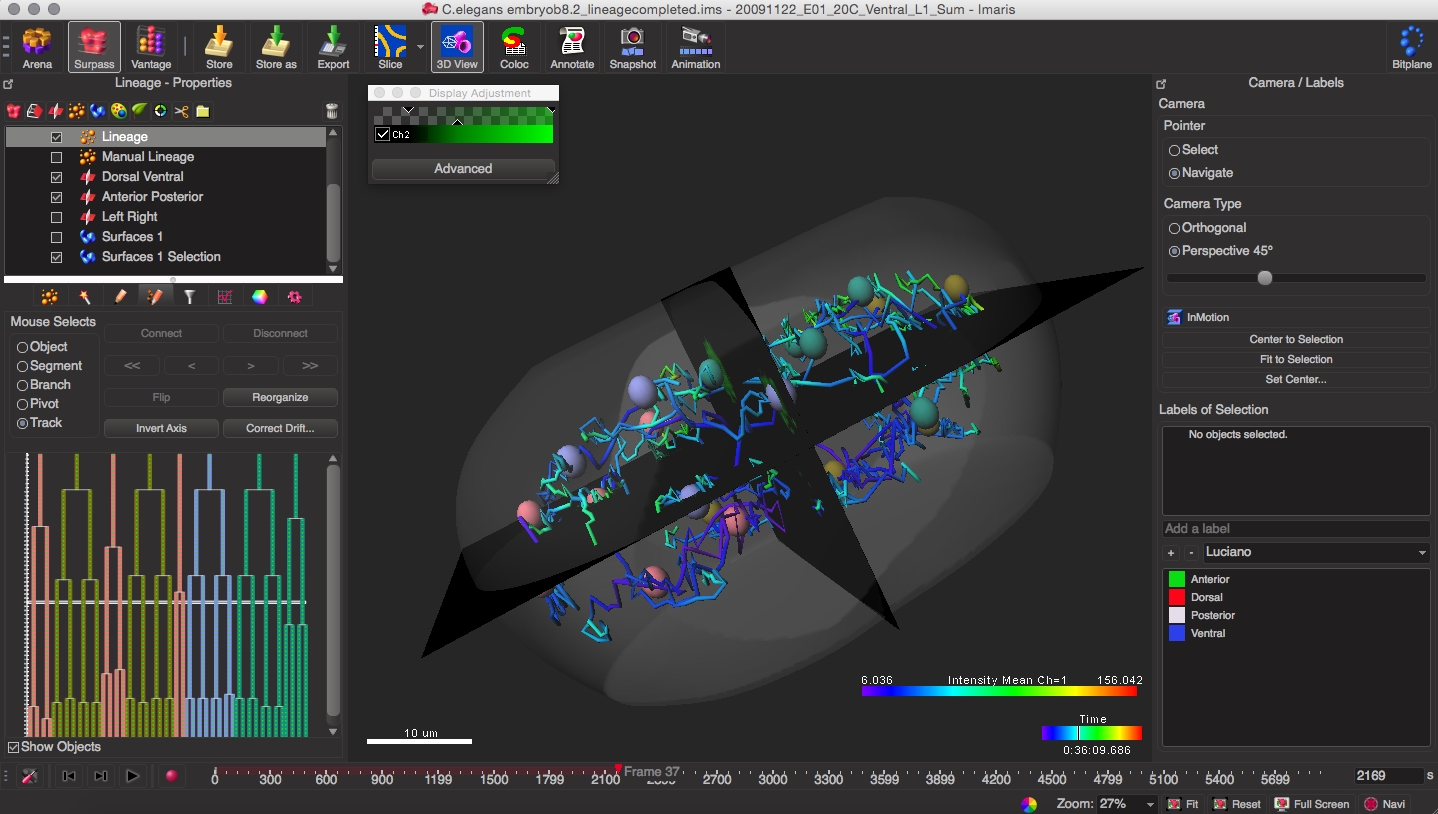
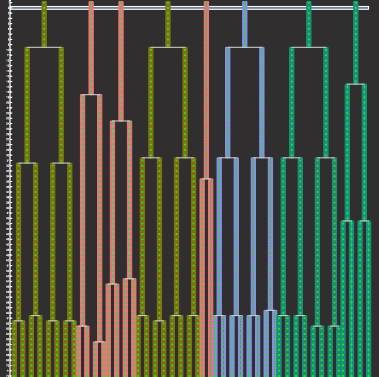
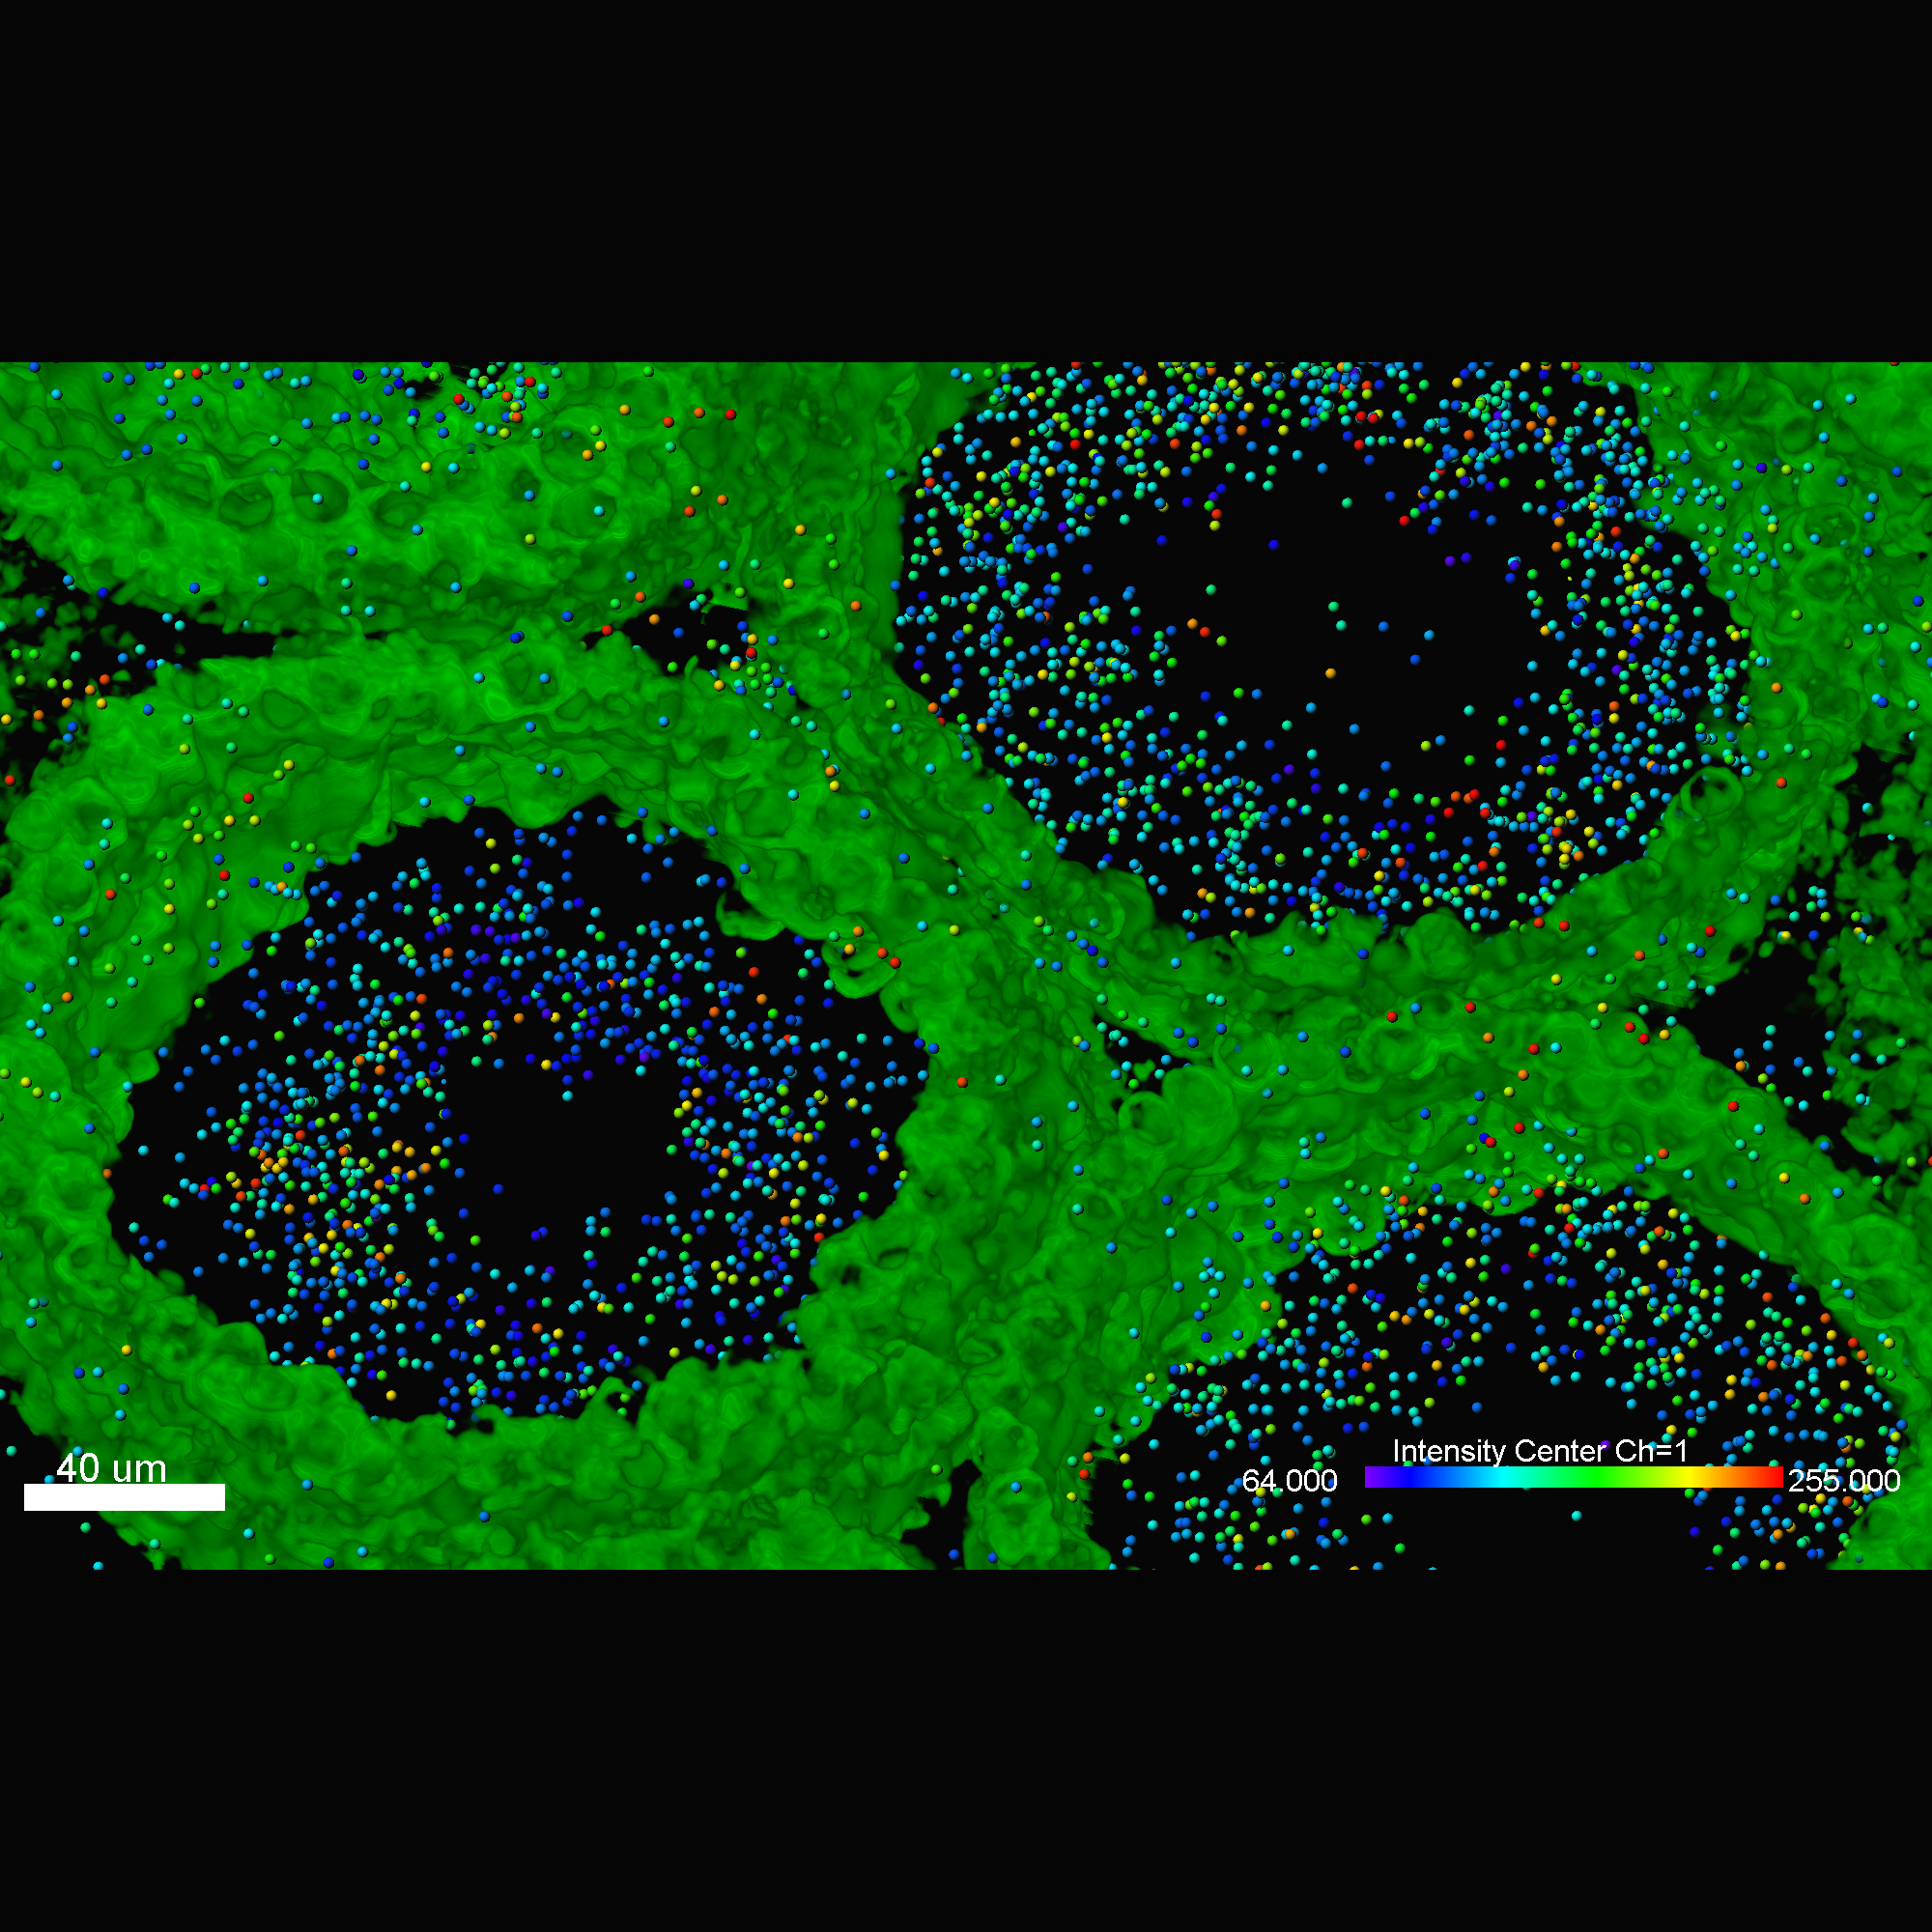
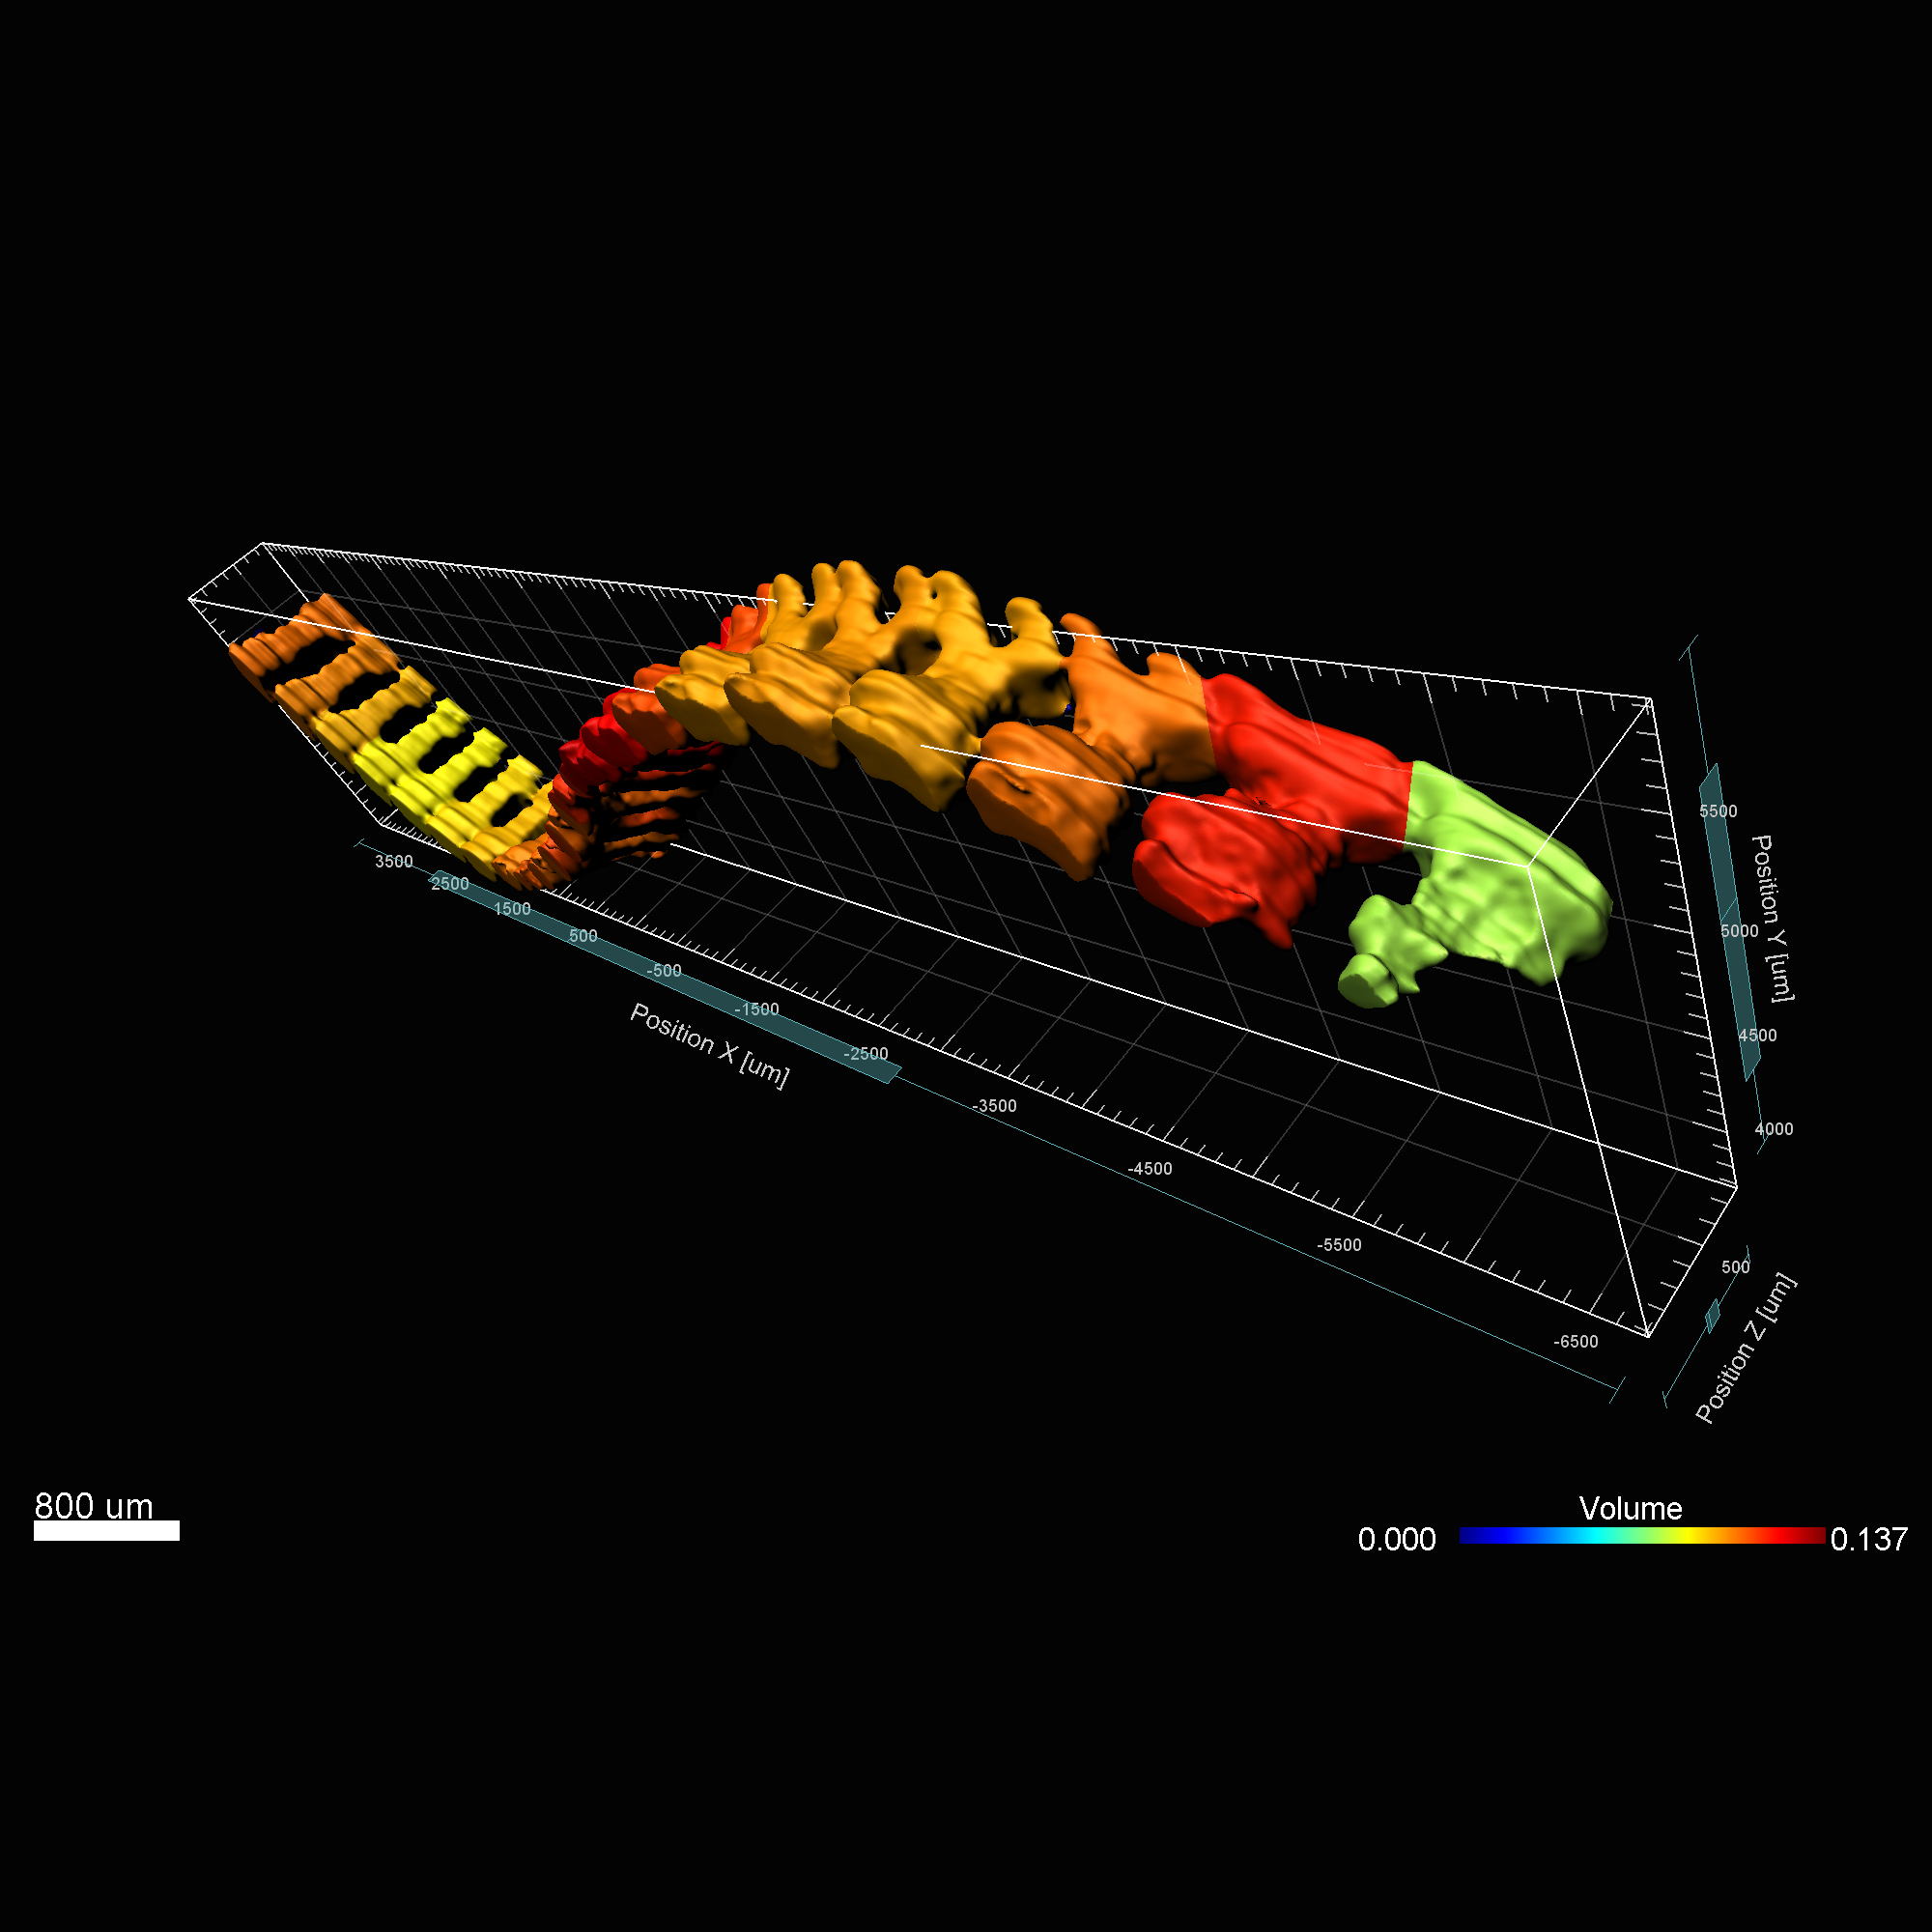
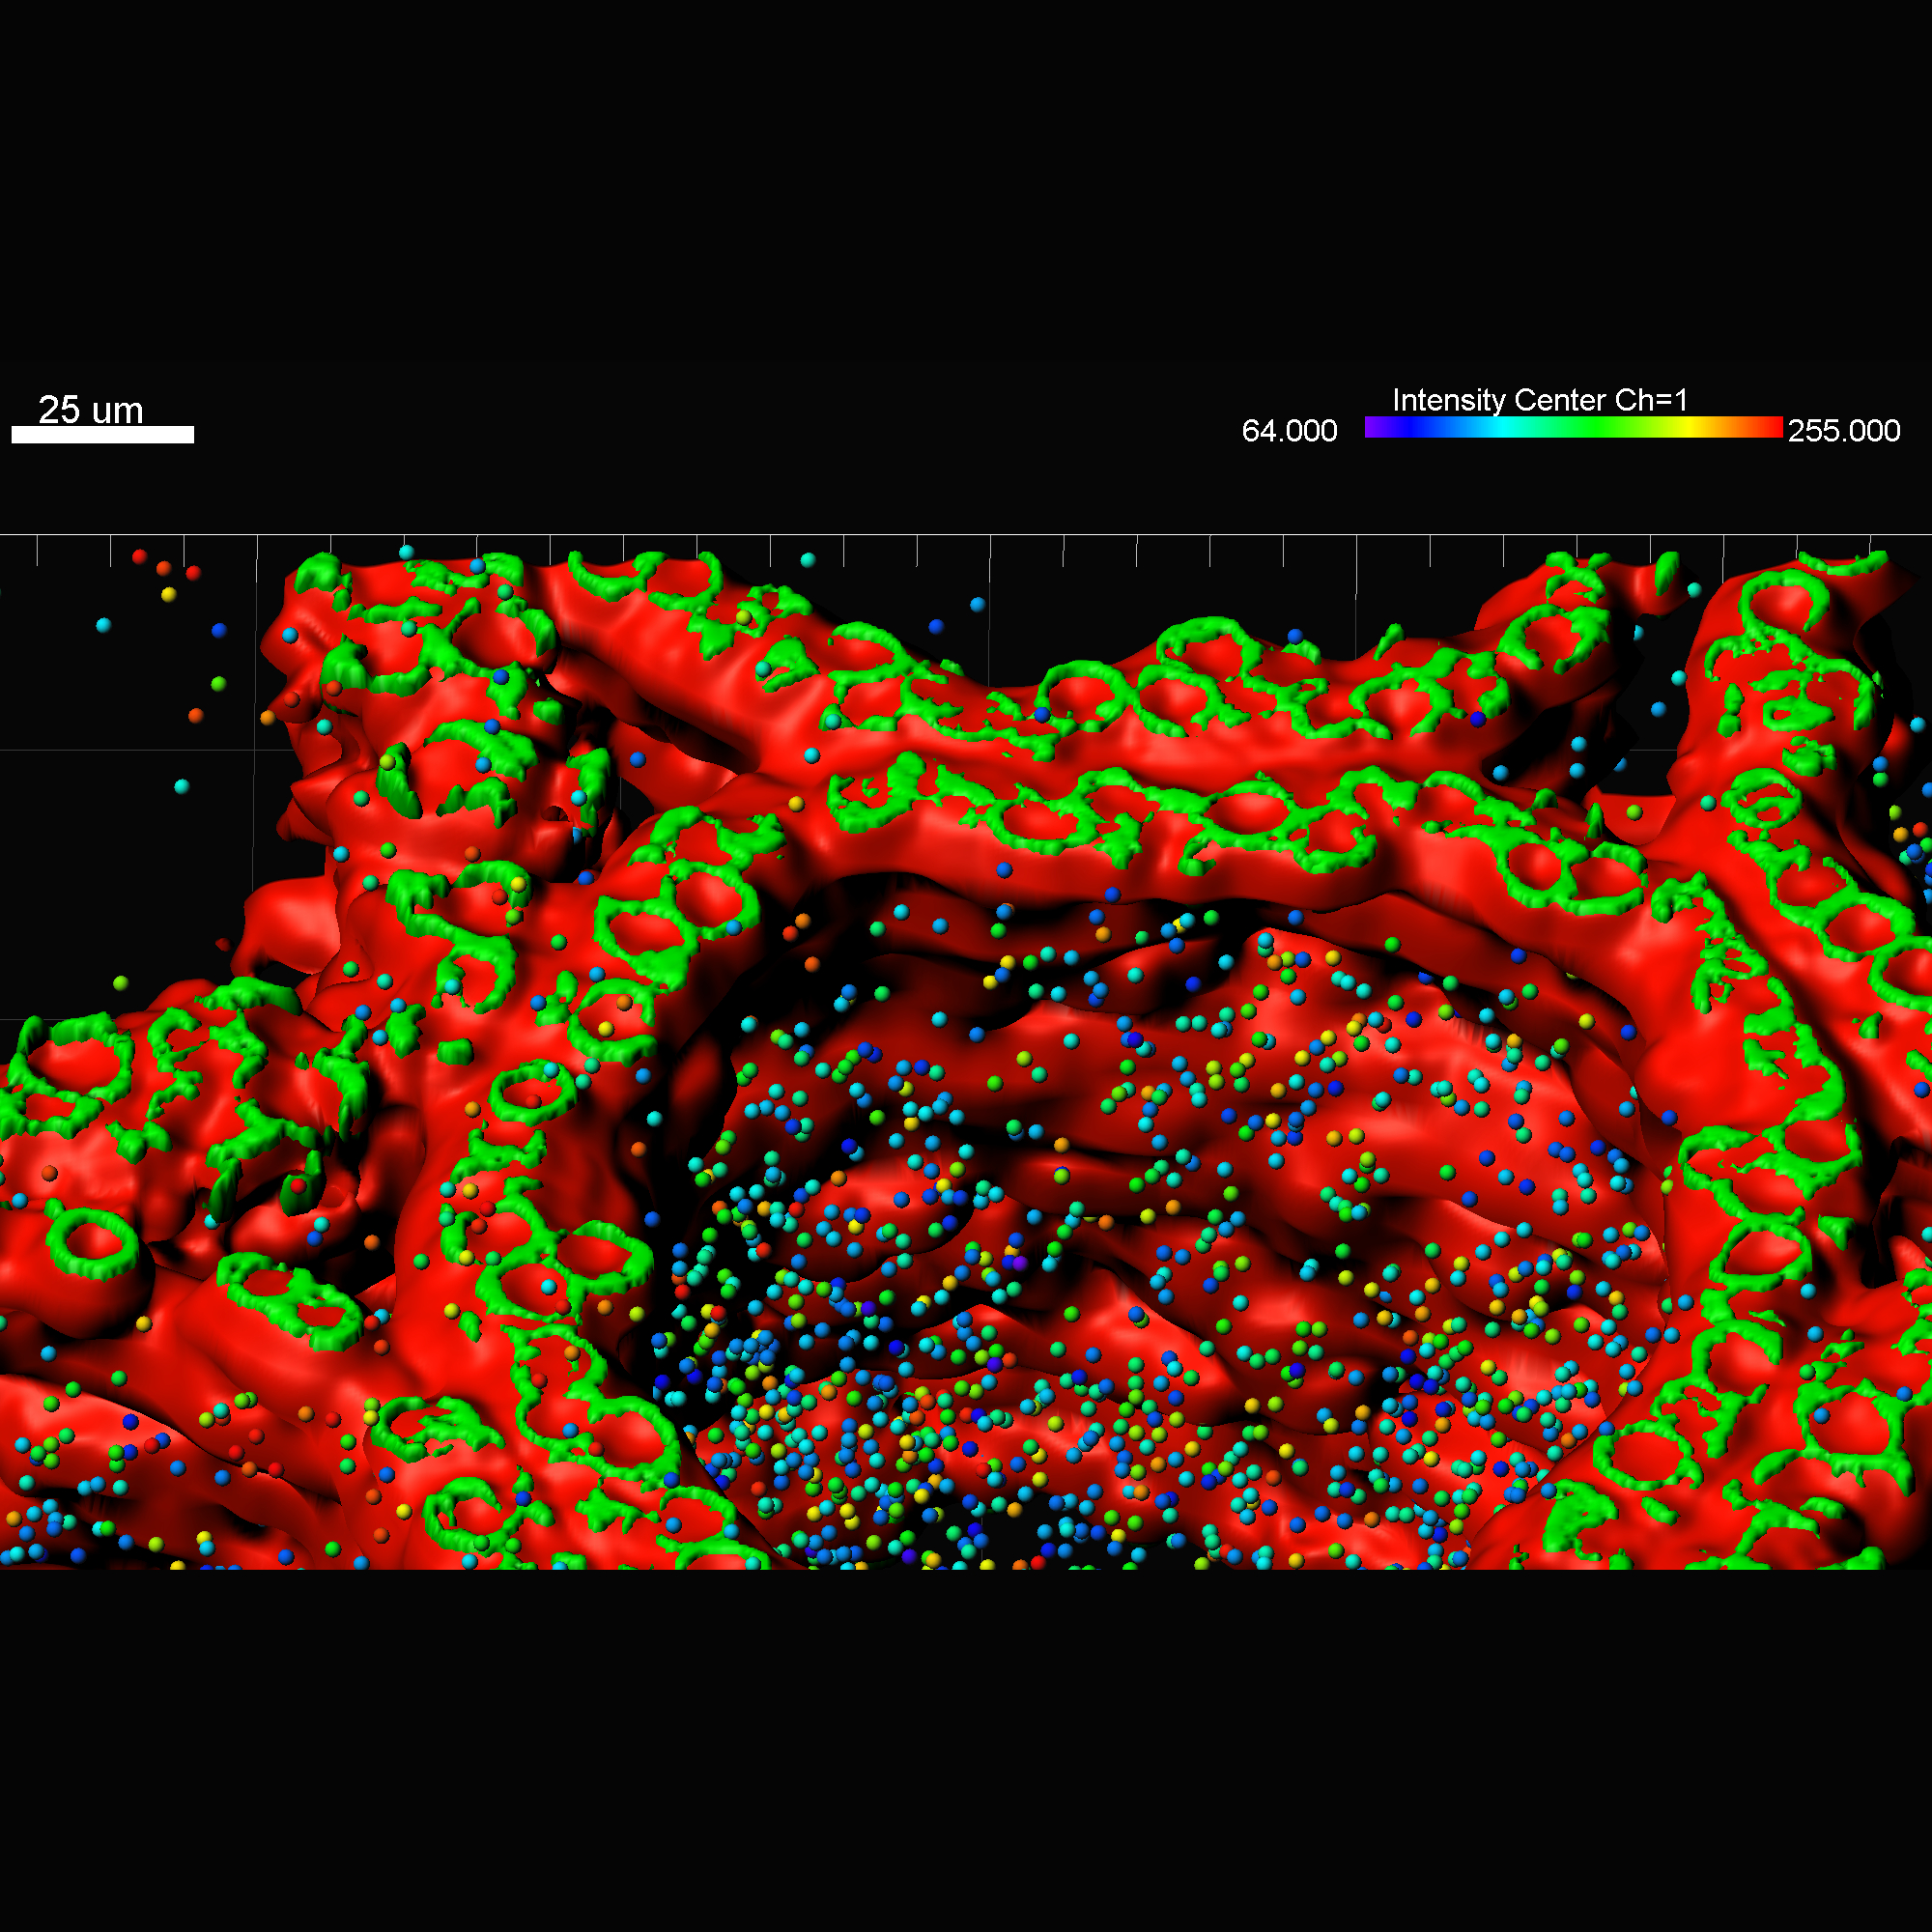
After segmenting the image data Imaris calculates a wide range of statistics through time for all detected objects, Surfaces and Spots. All values can be used for color coding, plotted inside Imaris (using Vantage plots) or exported in an .csv or .xls file format. Parameters presented below are the most common statistic types needed by biologists. Imaris reports many more.

Motion Analysis
  • Average Speed
  • Instantaneous Speed
  • Acceleration
  • Track Length
  • Cell cycle duration
Surfaces
  • Area
  • Volume
  • Intensity
  • Elipticity
  • Sphericity
Spots
  • Position (x, y, z)
  • Intensity
  • Number (count)
  • Distance from Reference Frame
Cell cycle
  • Cell Cycle Duration
  • Cell Cycle Displacement
  • Generation
  • Time Since First and Previous Division

Track Editor and Labels

Imaris for Tracking enables easy manual editing of the results of automated tracking. Use Labels to add additional descriptive parameters.

Track Editor

 
  • Connect or disconnect objects to amend results of automated tracking
  • Manually connect detected objects and create new tracks, cell divisions or fusions
  • Sort tracks or reorganize lineage tree branches
  • Add missing objects and connect them to the track
  • Color your tracks and objects simultaneously by any chosen statistical parameter
  • Export tracking results as .tif or .svg

Labels

 
  • Add Labels with colors describing unique features of objects or group of objects: cells coming from the same mother cell, cells which are close to each other, cells with similar speed
  • Color Spots and Surfaces according to assigned Labels to better visualize relationship between objects
  • Visualise objects with selected labels only
  • When statistical parameters are exported – Labels act as additional descriptive parameter and enable doing further analysis within selected groups.

Visualization and animation export

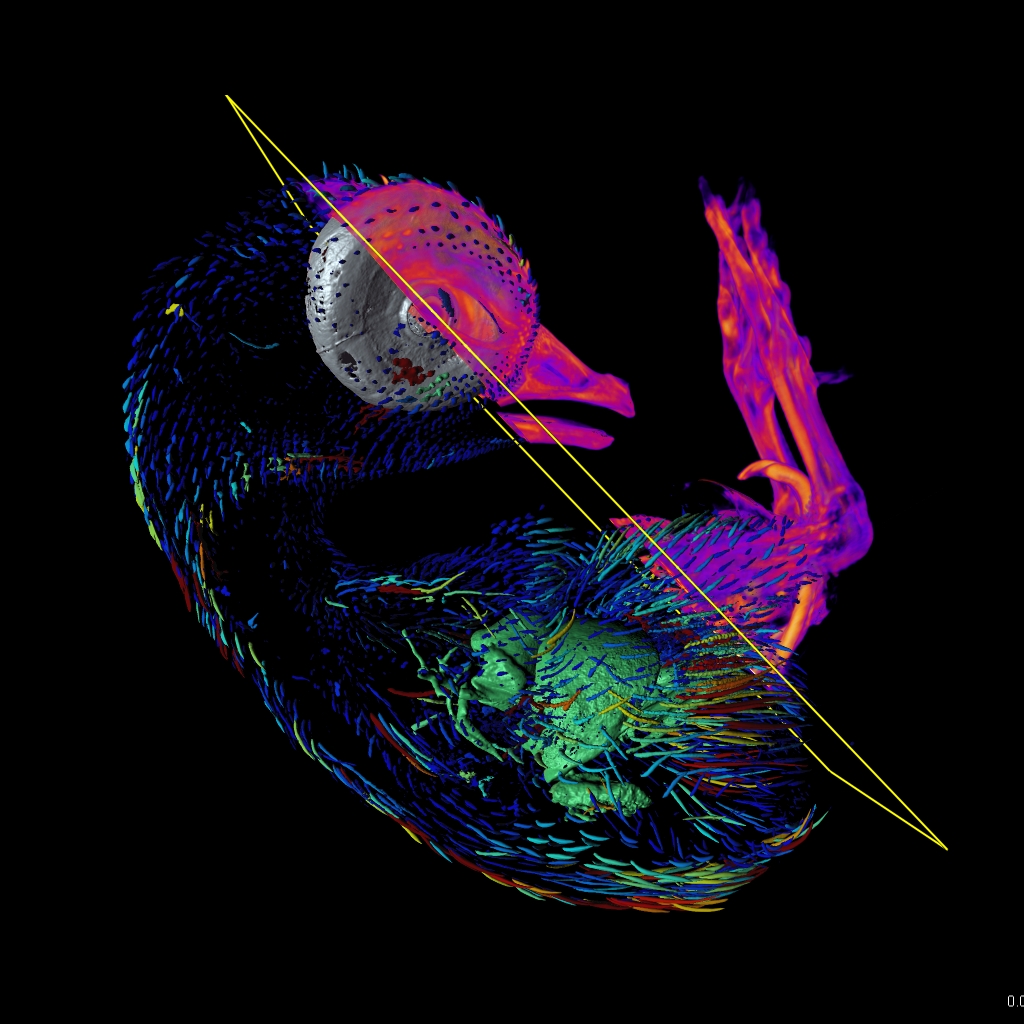
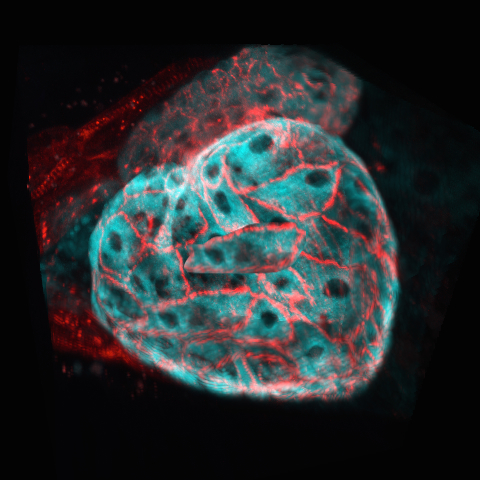
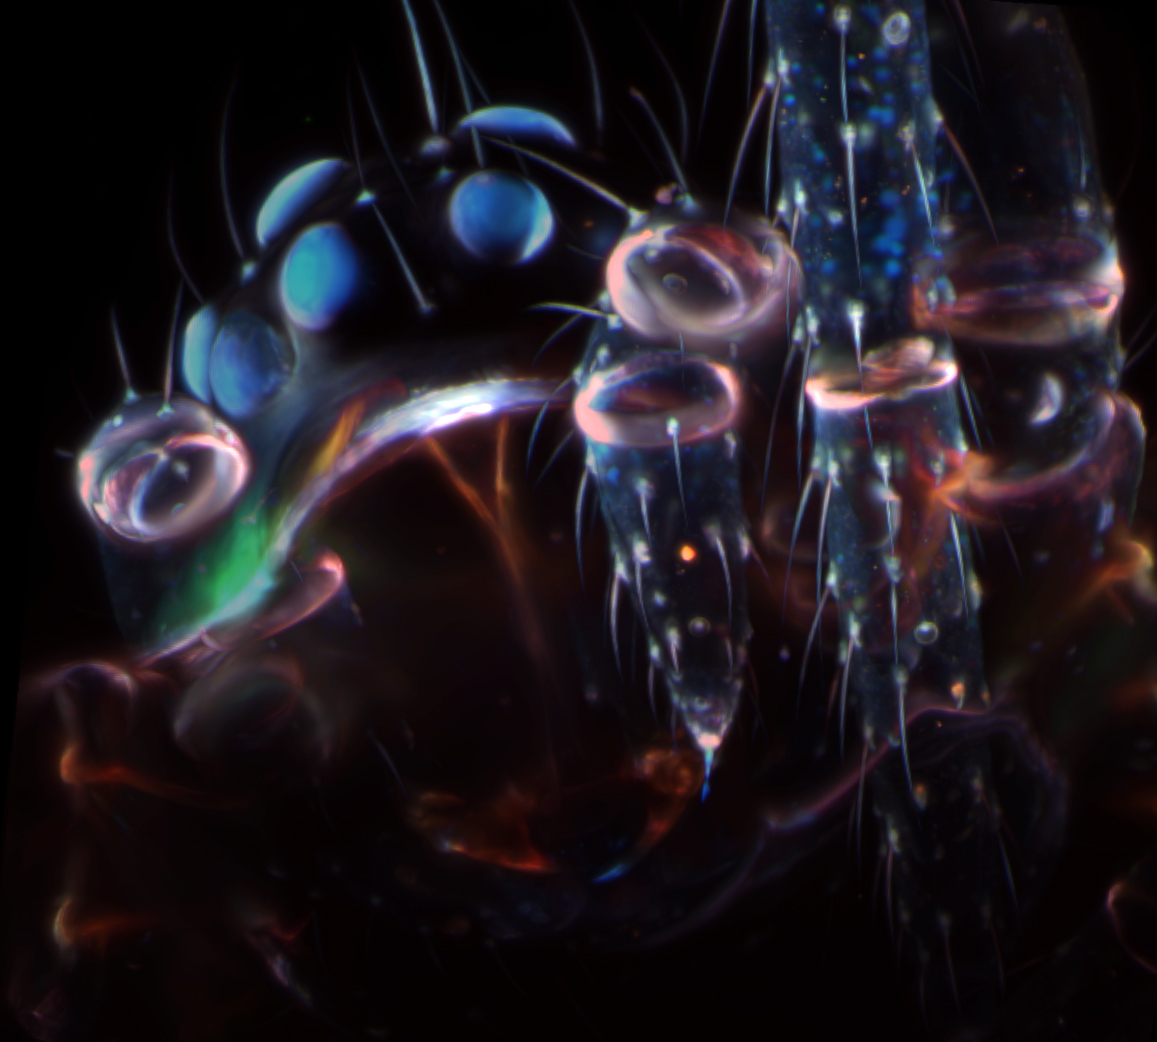
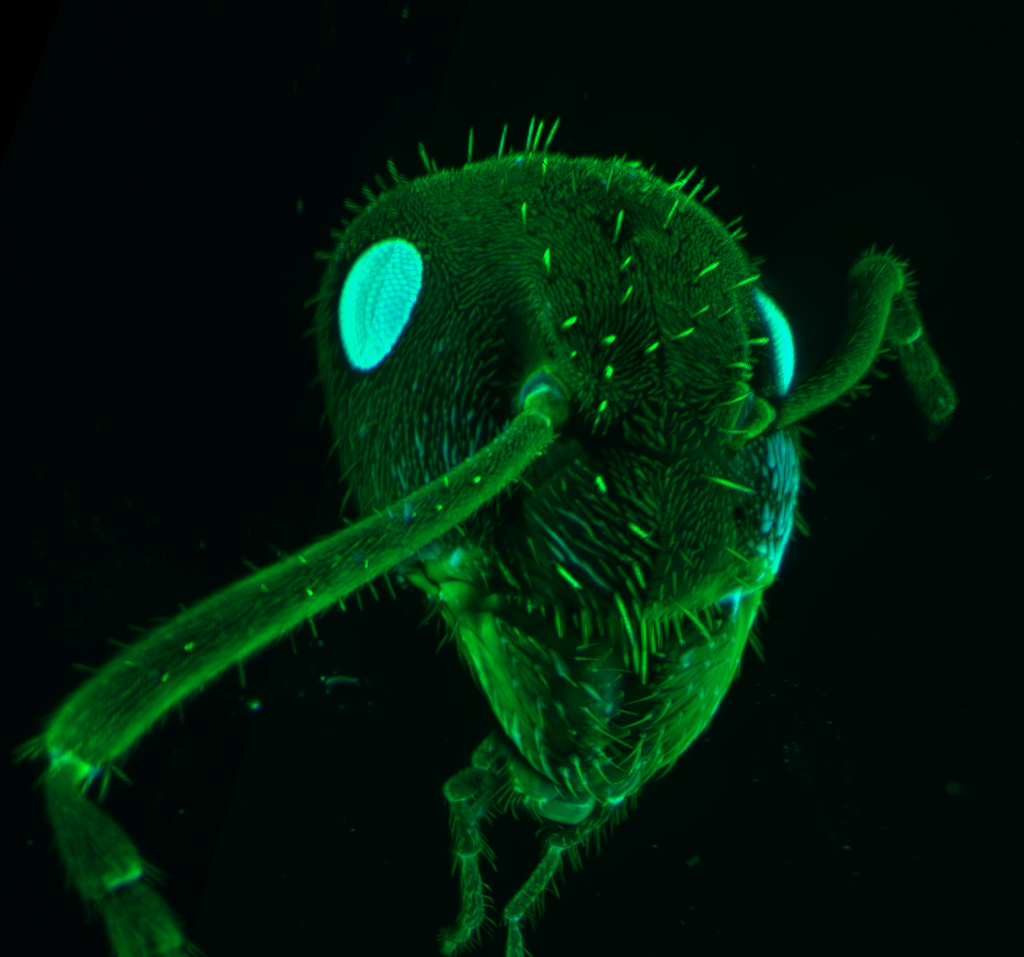
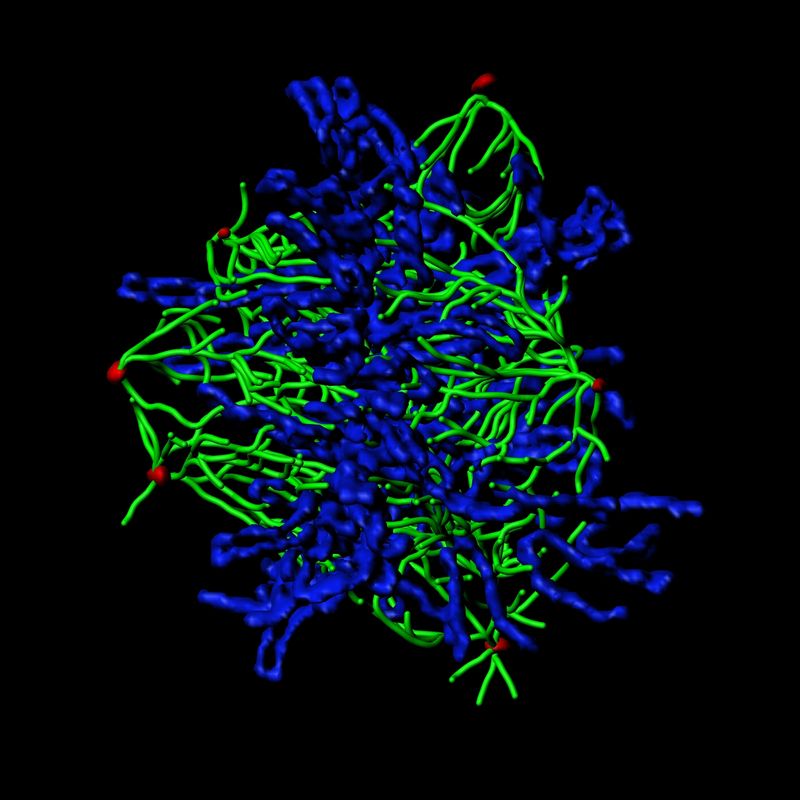
Imaris for Tracking provides a complete set of features for visualization of multi-channel microscopy datasets from static 2D images to 3D time series regardless of their size and format and multiple image and video export options to enhance your papers and presentations.


Additional Resources

The Imaris Learning Center hosts a wide range of tutorial videos, how-to articles and webinars to guide you through the many features of Imaris. We have provided some links below which will get you started on some of our most recent developments.