Part of the Oxford Instruments Group
Expand

Imaris Essentials 

The Imaris Essentials Package is an interactive visualization and analysis software for 3D and time-lapse microscopic images with advanced solutions for big datasets (Terabyte range) - smart Volume and Surface rendering based on our multi-resolution technologies, plus Surface calculations for images of unlimited size. Imaris Essentials Package is perfect for researchers who need an easy to use software for making stunning Snapshots and Animations, generating quantitative information from their microscopy data, object to object distance and overlap measurements, co-localization studies, plotting and statistical analysis. Imaris Essentials package includes easy to use Machine Learning Object Classifier and Labels.

Request Pricing/Free Trial Existing Customer - Satellite License

3D Visualization and Rendering for Microscopy

Imaris Essentials provides a complete set of features for visualization of multi-channel microscopy datasets from static 2D images to 3D time series regardless of their size and format. Using Imaris Essentials users can:

  • Organize and manage full experiments including images and data analysis
  • Use premier 3D/4D volume rendering modes: (MIP, Blend, Shadow Projection, Normal Shading)
  • Benefit from Imaris’ high performance IMS file format which guarantees smooth navigation even in very large datasets (Gigabytes to Terabytes range)
  • Combine volume rendering, object representation, clipping planes and 2D slicers
  • Easily make quality animations and high resolution snapshots ready for presentations and publications

Quantitative Microscopy Image Analysis - Detection of Objects

Imaris for Essentials provides multiple options to detect and model your biologically relevant structures via step-by-step wizards with a preview of the results at each point in the workflow.

Surfaces

Use Imaris 3D Surfaces to precisely visualize and measure shapes of various objects within your samples such as organelles, nuclei, biofilms, cells, tissues, organs, embryos, tissues as well as whole organisms.

  • Representations of a specified region of interest in the data set
  • Calculated based on global or local threshold or created based on user-defined regions of interests
  • Can be calculated and visualized for data sets up to terabytes in size
  • Act as a container from which all the desired statistics can be calculated
 

Spots

Use Imaris Spots to detect: particles, protein clusters, vesicles, nucleoli, nuclei, centrosomes, cells and bacteria.

  • Model point-like or vesicle-like structures in the data.
  • Can be identified in images with 10s or 100s of thousands of objects.
  • XYZ coordinates of each objects are calculated, relative distances to other objects can be measured
  • Can be tracked in time (5 high performance motion algorithms)
 

Machine Learning Object Classification

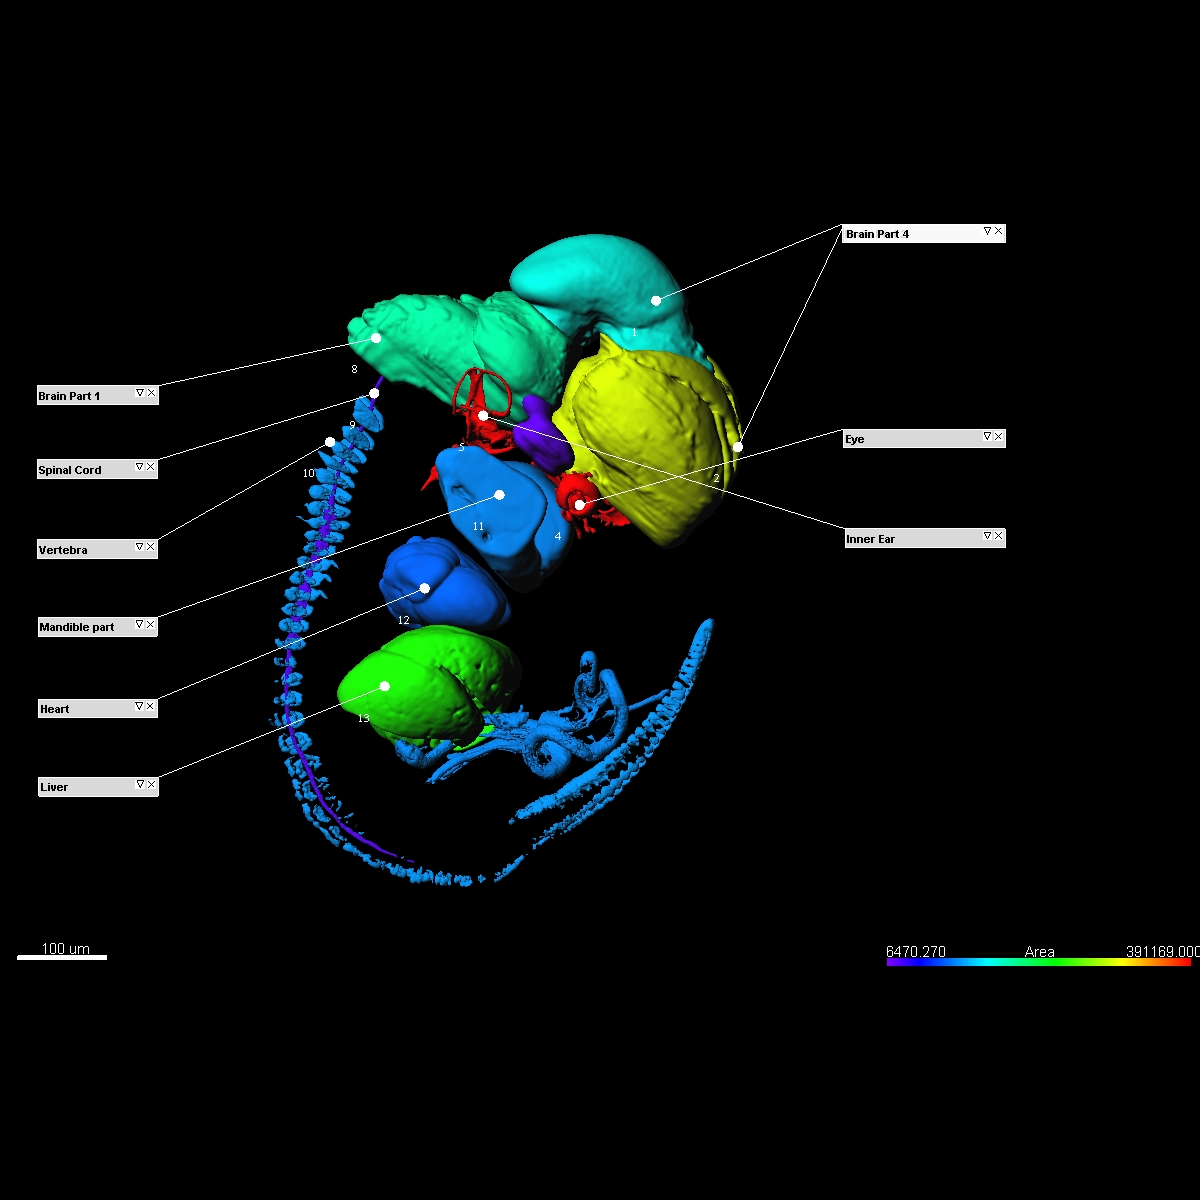
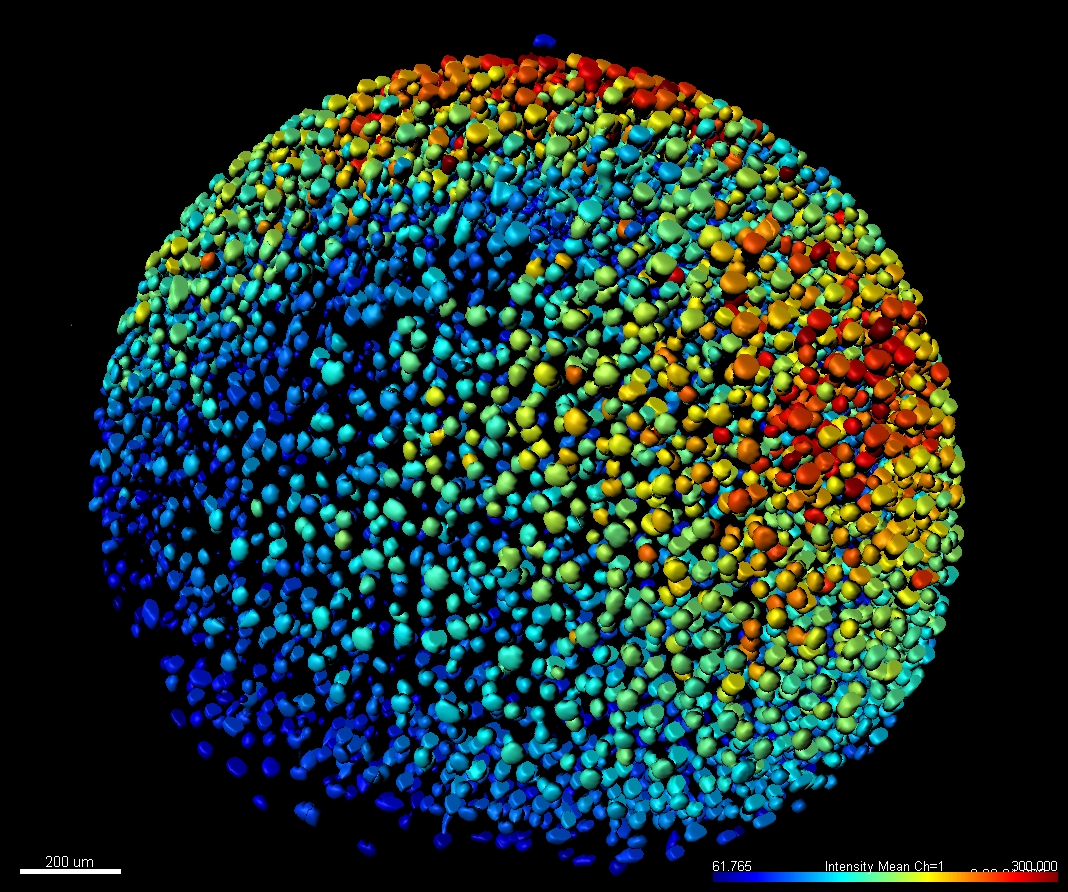
Automated classification of detected objects (cells, nuclei, vescicles) with a trainable Machine Learning Classifier (ML), based on selected statistic or the combination of 2 features. Classes are labelled and available for visual presentation, plotting and for downstream analysis (export of statistics).

  • Trainable Machine Learning Classifier
  • Objects classification based on their local environment or intrinsic features
  • Labels – classified objects are labelled (color and name), which is exported in statistics
  • Possibility to compare labelled classes

Distance Measurements, Spatial Interactions and Colocalization

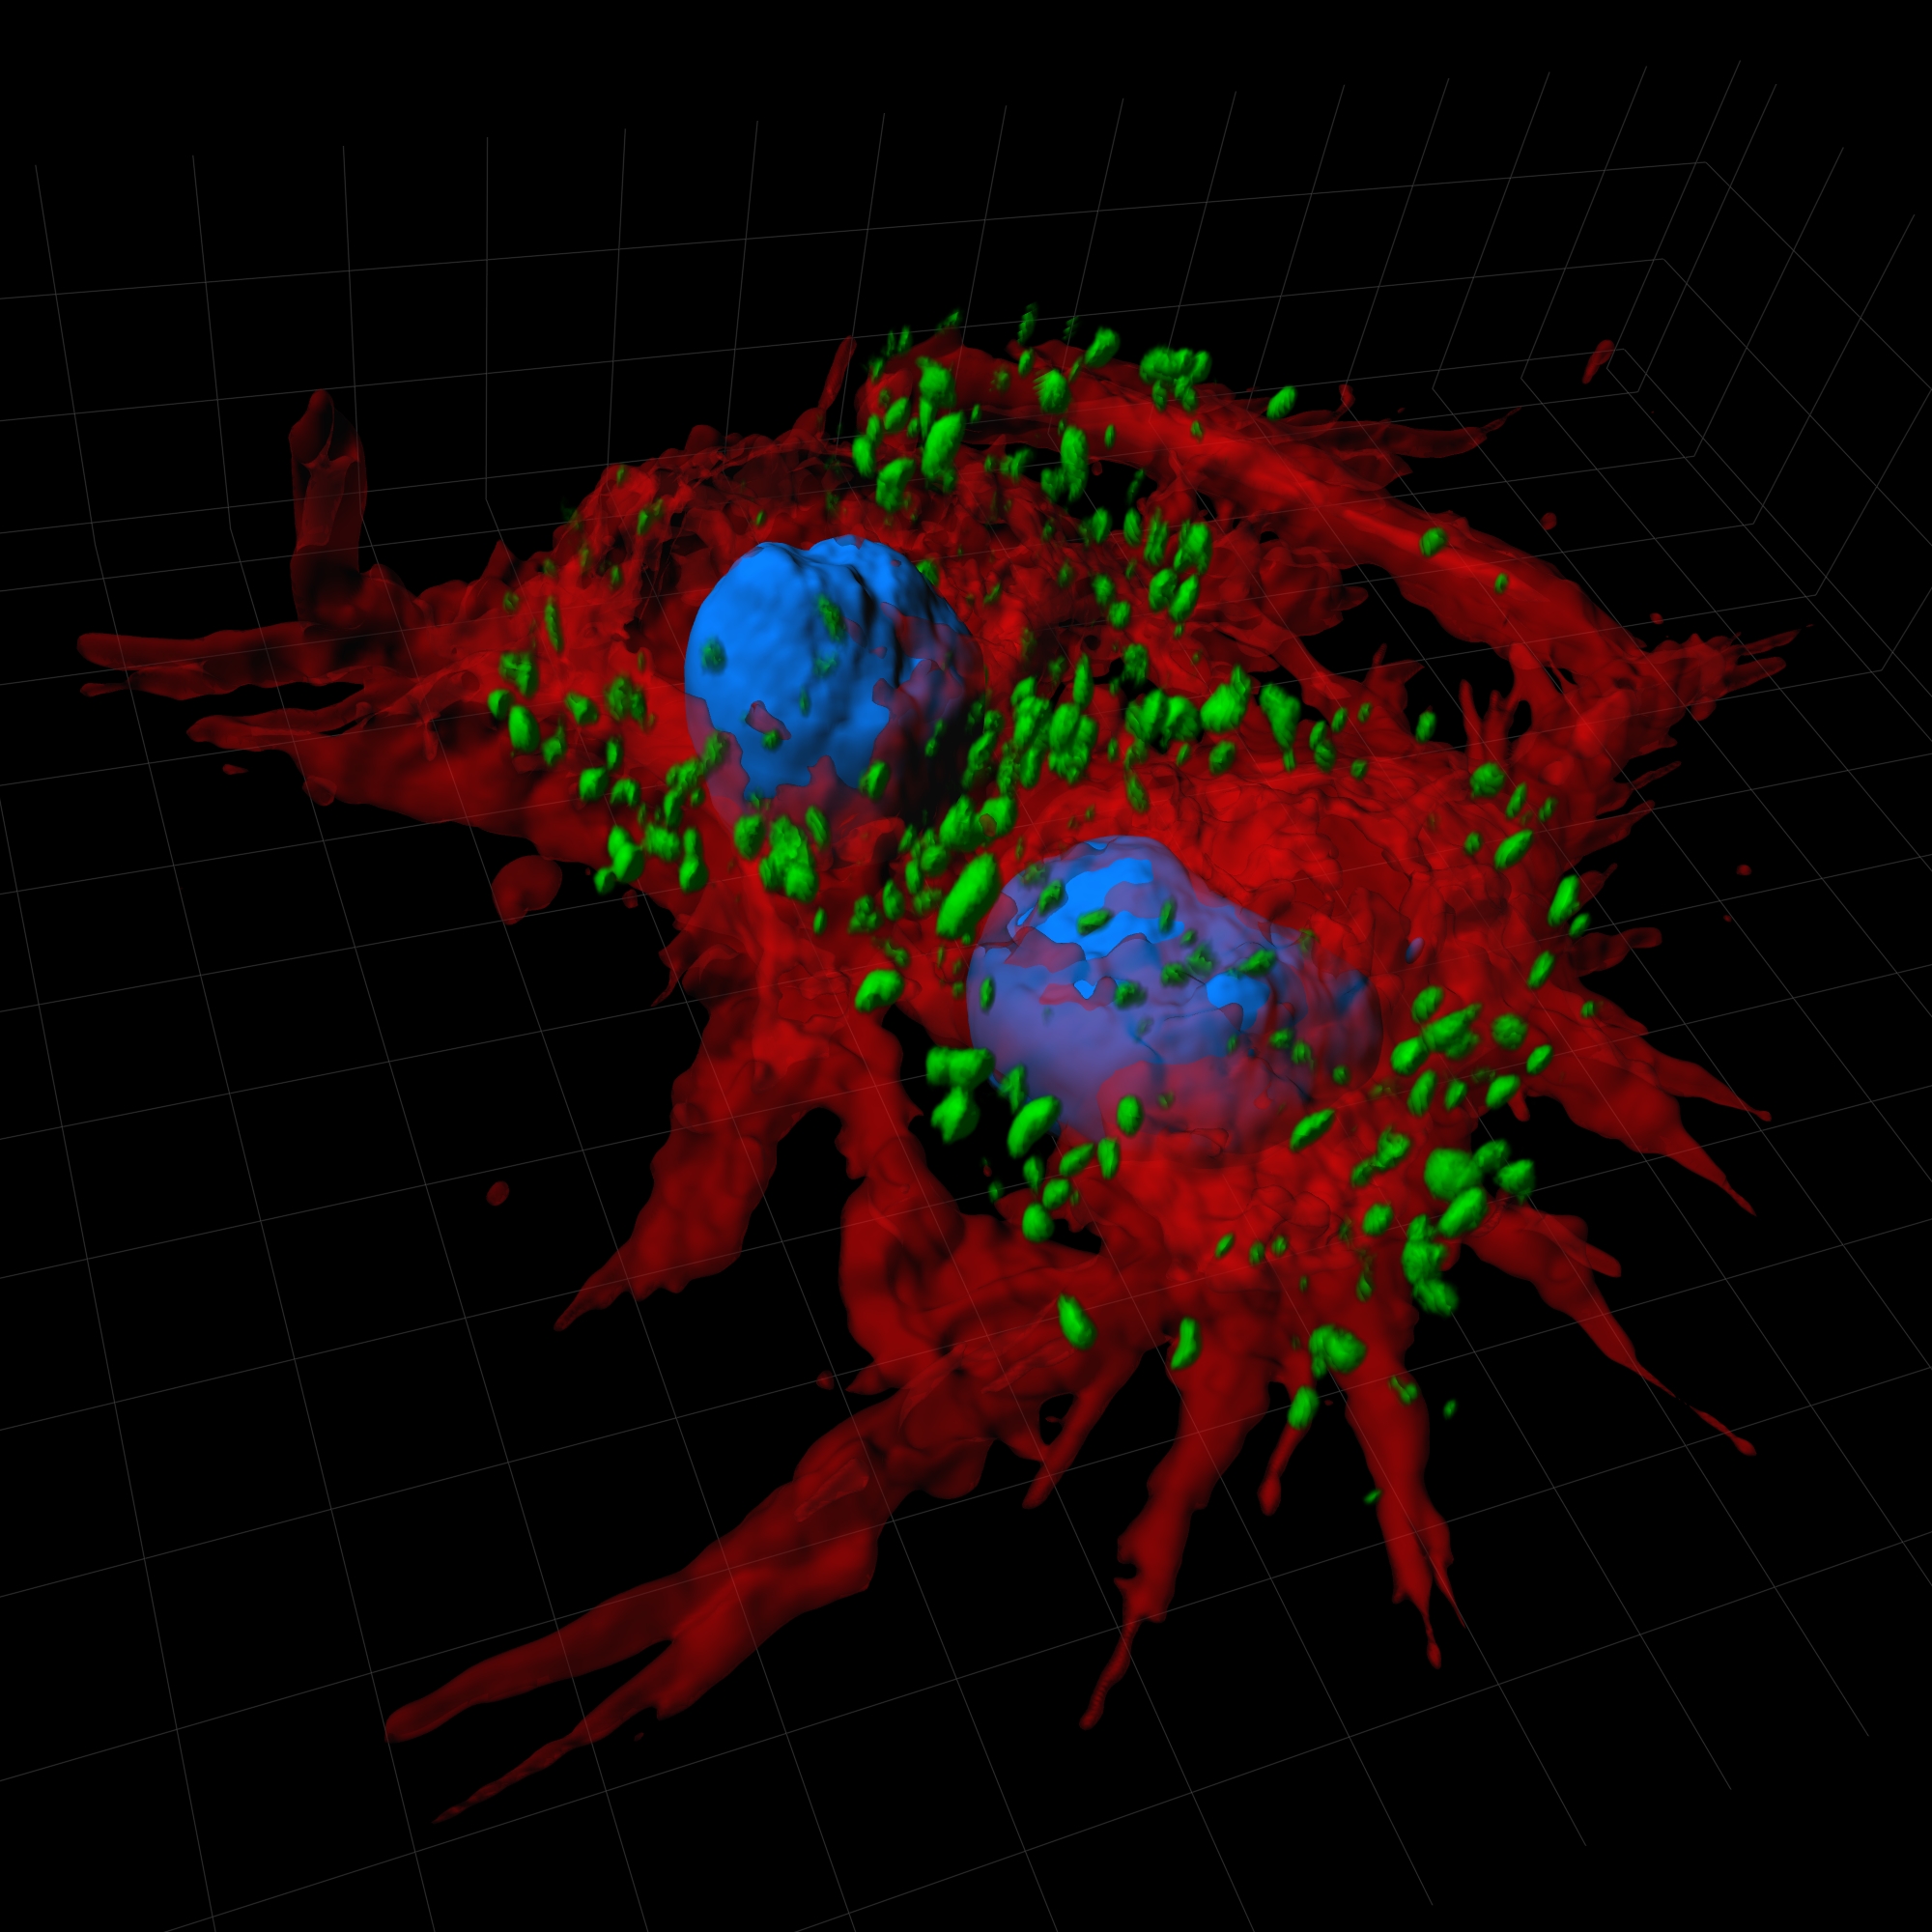
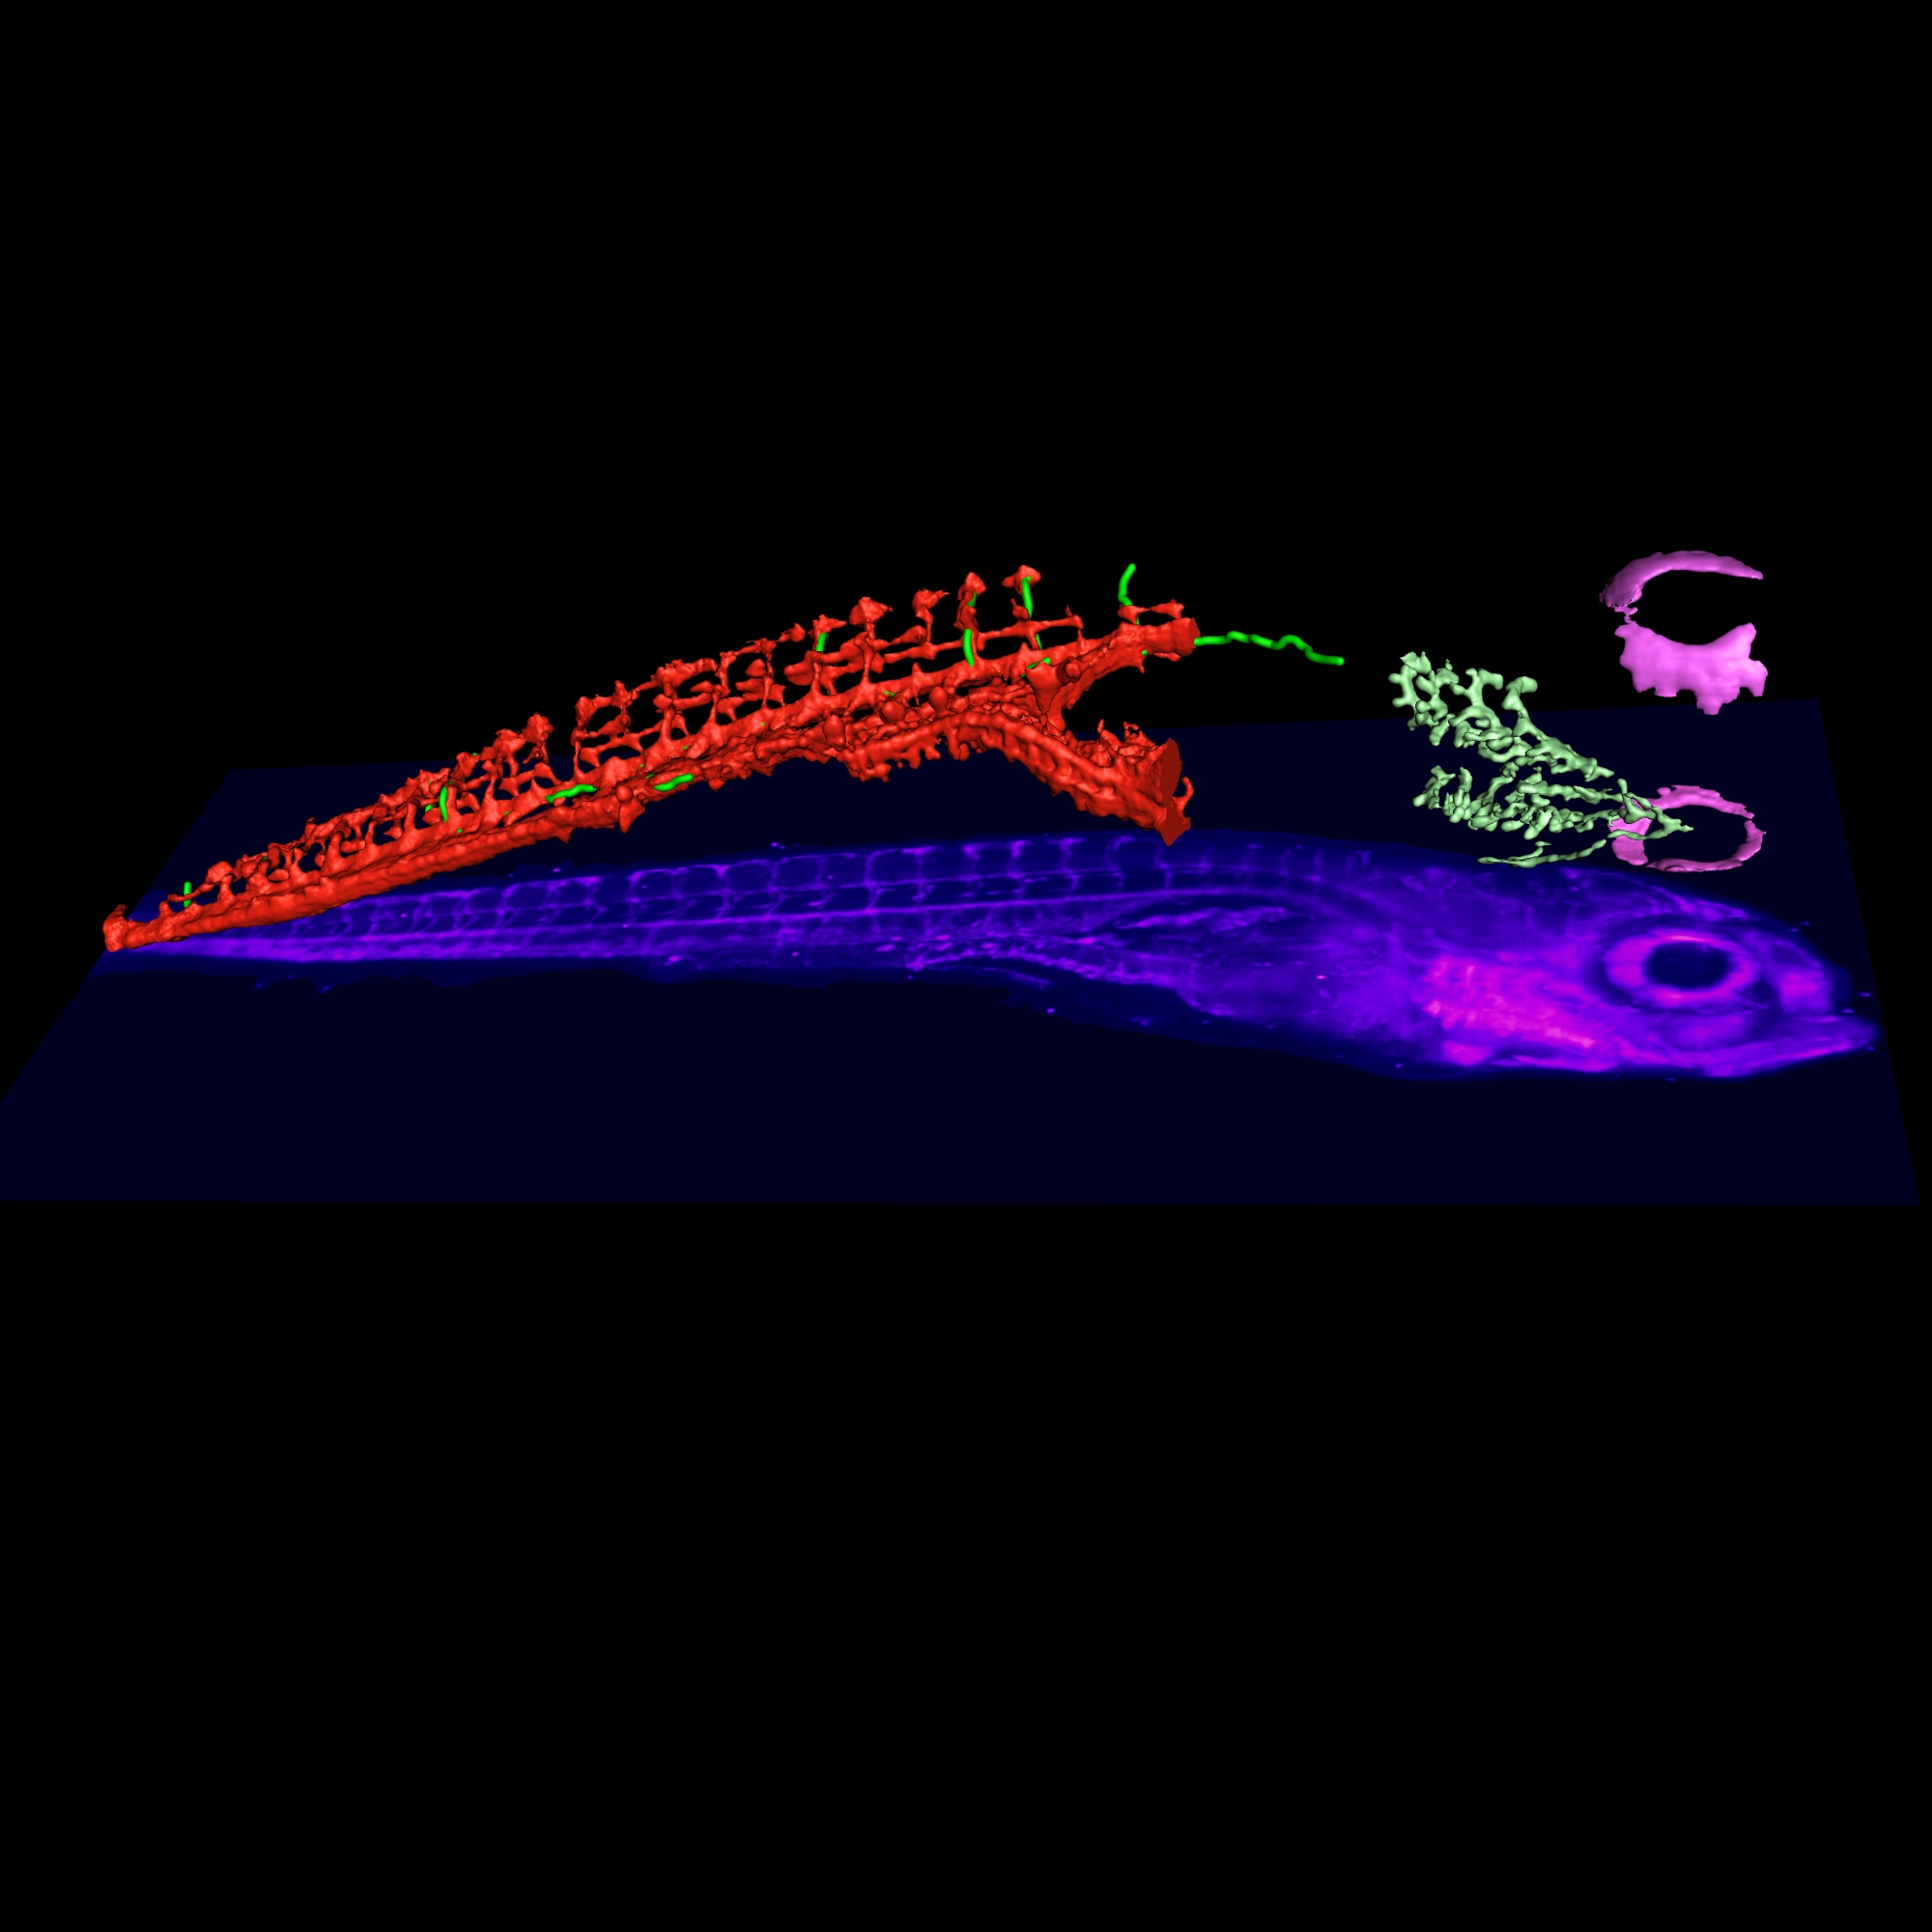
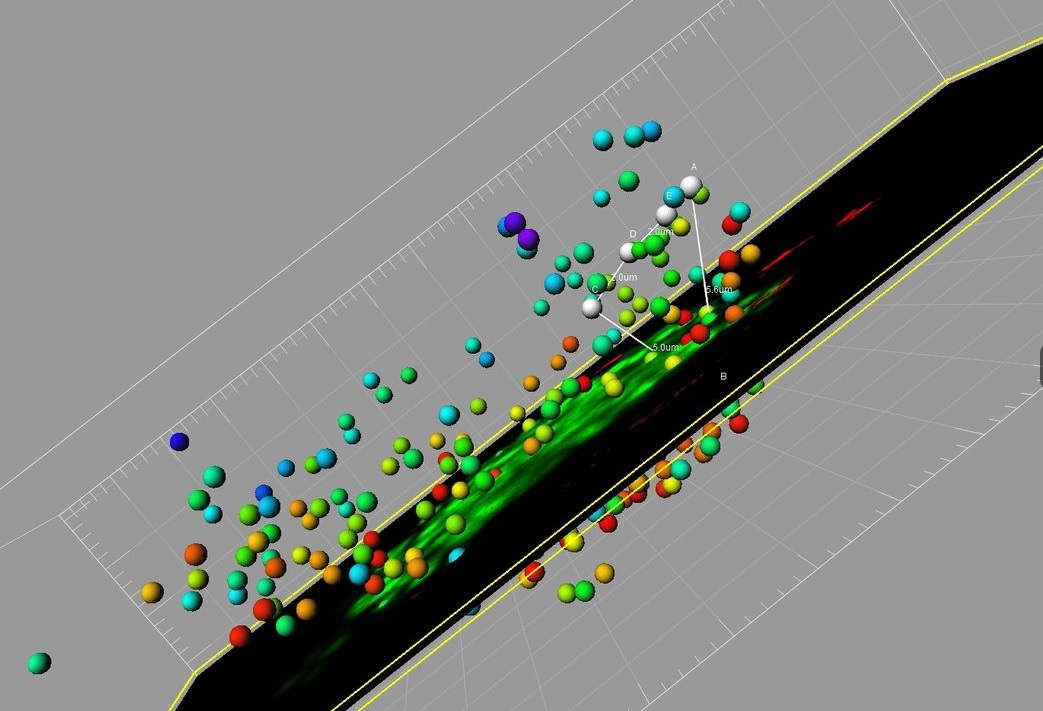
Imaris Essentials offers multiple ways to study interactions between biological structures based on their distribution in the 3D space. Imaris Essentials includes Coloc - the most powerful co-localization analysis tool to quantify and document co-distribution of multiple stained biological components.

  • Pearson’s coefficient, Mander’s coefficient, co-localized voxels, co-localized percentages calculated within Regions of Interest (ROIs)
  • Shortest distance to nearest Spots or Surfaces
  • Statistical calculations if selected Spots are attracted to the Surface of interest
  • Volume overlap between Surfaces

Plotting Tools and Data Mining

Imaris Essentials includes a seamlessly integrated tool to explore differences between experimental groups (e.g. control vs test) - ImarisVantage. It allows for the creation of interactive plots which help illustrate relationships/patterns/differences amongst object measurement or groups of objects and reveal hidden relationships.

  • Two-dimensional scatterplot
  • Spatial distribution plot with the reference to random distribution around the object
  • Single dimension box plot for group comparisons
  • Group comparison: t-Test, f-Test, Wilcoxon-Test, Kolmogorov-Smirnov Test
  • Interactive object gallery
  • Interactive multidimensional object scatterplot

Additional Resources

The Imaris Learning Center hosts a wide range of tutorial videos, how-to articles and webinars to guide you through the many features of Imaris. We have provided some links below which will get you started on some of our most recent developments. You can also check out what's new in the latest version of Imaris.