Applications
 Part of the Oxford Instruments Group
Expand
Collapse
Part of the Oxford Instruments Group
Hematology
The bone surrounding marrow is very difficult to cut or image through. However, researchers at the National Institutes of Health’s National Heart, Lung and Blood Institute have recently developed a technique to image wholemounts of bone marrow tissue using 3-D confocal fluorescence and confocal reflection microscopy. This novel imaging technique has helped to reveal the 3-D architecture of intact bone marrow, the site of blood cell production (hematopoiesis) in many animals.
Prior to this work, hematologists were mostly accustomed to two-dimensional views of the bone marrow, the primary hematopoietic organ and used cells in suspension after in vitro manipulation to infer functional and organization.” said Dr. Daniela Malide, a member of the research team. “We were the first to provide a large number of striking 3-D images and movies of murine and human marrow.”
Dr. Young’s research team used fluorescently labeled bone marrow to acquire 3-D confocal image stacks from murine models with marrow failure, as well as patients with aplastic anemia and myeloid and lymphoid cell malignancies. For each experiment, they imaged up to four colors sequentially, capturing x-y-z images typically 640 X 640 microns at 1 to 4 micron intervals along the z-axis. They also captured images using confocal reflection microscopy in order to help them visualize the outer bone edge and overall bone structure. Finally, adjacent image stacks were stitched together to provide visualizations on a larger portion of the tissue being analyzed.
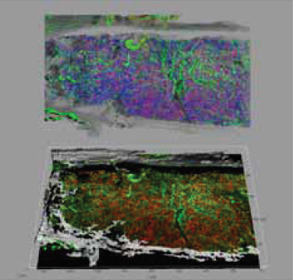
Using Imaris, the world’s leading 3D/4D image visualization and analysis software, the researchers transformed their confocal data into detailed 3-D models of the bone marrow. These models allowed them to observe the spatial arrangements of various cell types, as well as other components of the bone marrow. To capture this information in great detail, Dr. Young’s group made movies of the data rotating in 3D space. Multiple 3-D projection modes were used to convey different 3-D information about the data. (Figure 1).
For example, using the blend projection allowed the researchers to better see how overlapping objects were positioned relative to one another in 3-D space. This projection mode even worked with 2-D images due to its ability to enable the researcher to visualize the opacity/transparency of different channels.
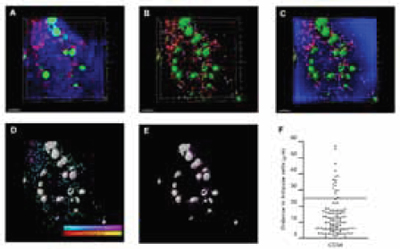
Imaris was also heavily used to extract statistical information from the acquired data to support what was evident from the visual observations. For example, the spot and isosurface function was one of the most useful tools of the software, said Dr. Tomoiku Takaku. It let them identify cells and other structures in the data which, in turn, helped them calculate the distances between them. Secondly, the researchers' group used the Imaris XT module, which can integrate specific, MATLAB-run open-source algorithms into the Imaris. They used this application to analyze cell numbers, positions and their spatial relationships (Figure 2). Acquiring statistics on the segmented components from the bone marrow allowed the researchers to understand the localization and interactions between the normal stem cells, the progenitor cells, the vasculature and the bone.
The combination of visual and quantitative results helped Dr. Young’s group concluded that their experimental approach can provide robust segmentation and quantitative analysis, as well as powerful visual information about the true nature of their data. More importantly, they felt that this approach could be used for other applications such as mouse leukemia, other human diseases and for visual assessment of drug effects.
Research Paper: Tomoiku Takaku, Daniela Malide, Jichun Chen, Rodrigo T. Calado, Sachiko Kajigaya and Neal S. Young, 2010 Hematopoiesis in three-dimensions: human and murine bone marrow architecture visualized by confocal microscopy. Blood, Vol. 116, No. 15, pp. 41-55. DOI 10.1182/blood-2010-02-268466.

© Oxford Instruments 2026