Applications
 Part of the Oxford Instruments Group
Expand
Collapse
Part of the Oxford Instruments Group
Dermatology
Xiao-Nong Wang and colleagues, Newcastle University
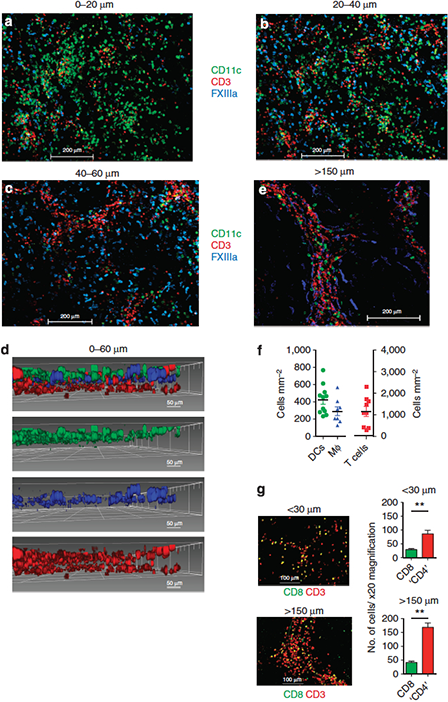
Distribution of immune cells at (a) 0 to 20 microns, (b) 20 to 40 microns, and (c) 40 to 60 microns beneath the dermoepidermal junction. (d) Imaris was used to create a three-dimensional reconstruction of a–c. In all images the dendritic cells (green), macrophages (blue), and T cells (red). (e) Distribution of dendritic cells, macrophages, and T cells at greater than 150 mm. (f) Scatter plot of number of dendritic cells, macrophages, and T cells per square millimeter of dermis up to 30 mm depth. (g) T cells at less than 30 microns and greater than 150 microns beneath the dermoepidermal junction. Reprinted from Wang et al. J Invest Dermatol 2014, 134(4):965-974.
Researchers led by Xiao-Nong Wang of Newcastle University in the United Kingdom, have used Imaris software to learn more about the spatial organization of cells that make up the skin’s immune system. Their work provides a detailed three-dimensional atlas of immune cells in diseased and normal skin.
The lower layer of our skin, called the dermis, contains blood vessels, lymph vessels, hair follicles, and glands that produce sweat. It also contains the major components of the skin’s immune system, including leukocytes such as dendritic cells, macrophages, and T cells. Previous studies have examined immune cells, blood vessels, and lymph vessels in human skin but lacked the resolution to reveal the relationship of vascular networks and immune cells.
The Newcastle researchers used whole-mount dermal sheet microscopy and Imaris to gain a three-dimensional view of the human dermis. They began by imaging immunostained samples using fluorescence microscopy. They acquired images of the samples epidermis-side-up and then turned the tissue to scan the dermal face. Using Imaris, they created three-dimensional reconstructions of the dermis and counted the immune cells.
“The most useful Imaris functions for this study were its ability to distinguish spatial distribution of different cell populations and to identify the proportion of perivascular or interstitial distribution for a particular dermal leukocyte population,” Wang said. “We were also able to compare those distributions between different cell populations.”
The skin in three dimensions
To visualize the cellular distribution of dendritic cells, macrophages, and T cells, the researchers created a three-dimensional reconstruction from optical sections imaged up to 60 microns beneath the dermoepidermal junction. It showed that dendritic cells formed the first dermal cellular layer that was up to 20 microns beneath the dermoepidermal junction; macrophages were located deeper, at 40 to 60 microns; and T cells were observed throughout the 60-micron depth.
Next, the researchers used Imaris to quantitate the patterns of distribution, comparing healthy dermis at depths of less than 30 microns beneath the dermoepidermal junction with depths of more than 30 microns. At greater than 150 microns, dendritic cells were mostly perivascular. Macrophages were both perivascular and interstitial at less than 30 microns but primarily perivascular at deeper than 150 microns. T cells formed perivascular sheaths throughout the dermis, and none of these immune cells had any specific spatial relationship with lymphatic vessels. The spatial architecture varied in skin that was diseased or inflamed.
Overall, the study findings suggest that there are anatomical micro-domains in the human dermis that likely play an important function. A better understanding of the microanatomy of dermal immune cells will provide even more insight into how they are functionally organized.
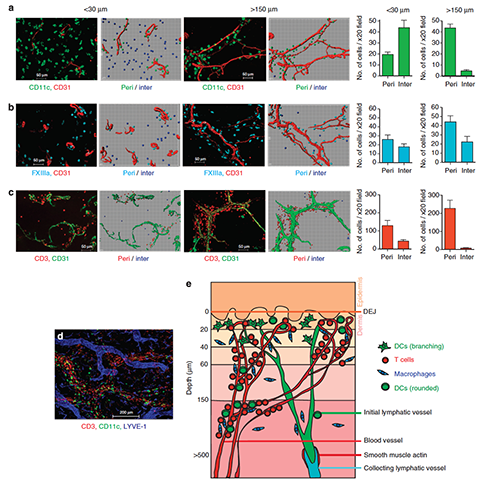
Distribution of (a) dendritic cells (green), (b) macrophages (blue), and (c) T cells (red) in relation to blood vessels at less than 30 and more than 150 microns beneath the dermoepidermal junction (DEJ). Accompanying Imaris software representation is shown on the right. Bar graphs show the number of cells in ?20 field found in perivascular (peri; less than 15 microns from vessel) and interstitial (inter; greater than 15 microns from vessel) distribution; mean±SEM. (d) Distribution of dendritic cells (green), macrophages (blue), and T cells (red) with lymphatic vessels (blue). (e) Schematic diagram illustrating the distribution of dermal leukocytes. Reprinted from Wang et al. J Invest Dermatol 2014, 134(4):965-974.

© Oxford Instruments 2026