
Applications
 Part of the Oxford Instruments Group
Expand
Collapse
Part of the Oxford Instruments Group
Case Studies
Published: 10 Feb 2021 · Last updated: 10 Feb 2021
Neuroscience
Dr. Ruth Benavides-Piccione and colleagues, Consejo Superior de Investigaciones Científicas and Universidad Politécnica de Madrid
Researchers led by Dr. Ruth Benavides-Piccione from Consejo Superior de Investigaciones Científicas and Universidad Politécnica de Madrid in Spain used Imaris software to study the three-dimensional morphology of thousands of human cortical dendritic spines. Their analysis revealed that the morphology of dendritic spines likely changes as we age.
Dendritic spines are small protrusions that emerge from dendrites. They are the primary postsynaptic elements of excitatory synapses in the cerebral cortex, and recent studies have shown that dendritic spines are dynamic structures and that fluctuations in their volume are likely important in cognition and memory. The researchers wanted to study the morphology of dendritic spines to better understand how it is tied to cortical information processing.
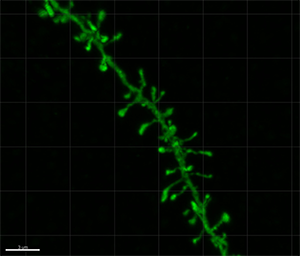
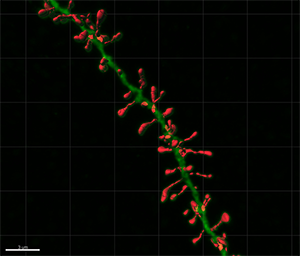
Figure 1 - Confocal microscopy image showing an intracellular injected basal dendritic segment of a layer III pyramidal neuron of the human cingulate cortex. Figure 2 - Three-dimensional reconstruction of the complete morphology of each human dendritic spine shown in Figure 1. Images courtesy of Dr. Ruth Benavides-Piccione.
“Imaris allowed us to manually generate an accurate large, quantitative database of complete 3D reconstructions of human dendritic spines, which, as far as we are aware, had never been examined in 3D,” said Dr. Ruth Benavides-Piccione. “Thus, the capability of Imaris software to generate 3D reconstructions helped us to reveal the real shape of human dendritic spines.”
The investigators analyzed over 8900 individual dendritic spines on pyramidal neurons in fixed tissue samples from a 40-year-old male and an 85-year-old male. They administered intracellular injections of Lucifer Yellow into individual pyramidal neurons and then acquired confocal image stacks of apical and basal dendrites.
The researchers first analyzed the dendrites, measuring the diameters at a dendrite’s beginning and the end as well as before and after each dendritic node. They calculated the volume for each dendritic shaft by selecting a threshold that represented a solid surface matching the contour of the dendritic shaft.
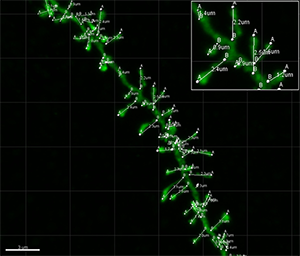
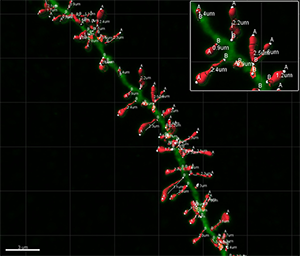
Figure 3 - Dendritic spine lengths measurements of each dendritic spine shown in Figure 1. Figure 4 - Combination of dendritic spine volumes and dendritic spine lengths of basal dendritic segment displayed in Figure 1. Images courtesy of Dr. Ruth Benavides-Piccione.
Dr. Benavides-Piccione says that the Imaris surface rendering, although not specifically designed for spine reconstruction, provided an accurate reconstruction of surfaces that allowed them to create a protocol to precisely represent the complete 3D structure of thousands of dendritic spines.
A single intensity threshold would not accurately represent the head and neck volumes of all the spines in a particular dendrite, so they created 7 to 10 different intensity threshold surfaces for each stack of images. They then selected a particular threshold to constitute a surface that exactly matched the contour of a specific dendritic spine. This sequence was repeated for each dendritic spine to reconstruct its volume along the length of the dendrite. With Imaris, they could cut, join, and split surfaces to create surfaces of different intensity thresholds, which captured the complete morphology of a particular dendritic spine (head and neck).
The investigators also used the Imaris 3D Measurement Points to manually mark each individual dendritic spine’s length from its point of insertion in the dendritic shaft to the distal tip of the spine, while rotating the image in 3D. They calculated dendritic spine density by counting the number of spines per 10 microns of dendritic length, starting at the soma and continuing to the distal tips of the dendrites.
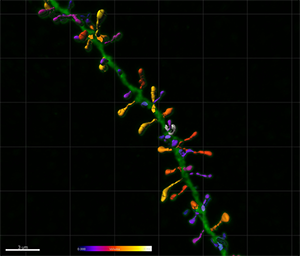
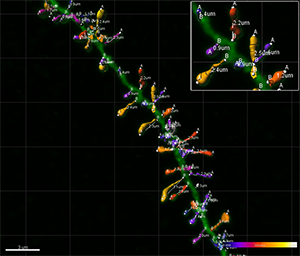
Figure 5 - Estimation of the spine volume values shown in Figure 2 illustrated with color codes. Figure 6 - Combination of the spine volume values from Figure 5 and the dendritic spine lengths measurements shown in Figure 3. Images courtesy of Dr. Ruth Benavides-Piccione.
This detailed analysis of dendritic spine morphology revealed that the neurons from the older person exhibited a lower density of dendritic spines. Specifically, small and short spines of basal dendrites and long spines of apical dendrites were lost, regardless of the distance from the soma. The researchers say that given the age difference between the cases, their results suggest selective alterations in spines with aging in humans.
“We are currently working on the reconstruction of the detailed structure of human dendritic spines in other cortical regions using the same protocol described above,” says Dr. Benavides-Piccione. We also plan to use the Filament tracer module for future studies that involve the analysis of the detailed 3D morphology of dendritic spines.”
Research Paper: Benavides-Piccione R, Fernaud-Espinosa I, Robles V, Yuste R, Defelipe J. Age-Based Comparison of Human Dendritic Spine Structure Using Complete Three-Dimensional Reconstructions. Cereb Cortex. 2012 Jun 17. [Epub ahead of print].

© Oxford Instruments 2026