Applications
 Part of the Oxford Instruments Group
Expand
Collapse
Part of the Oxford Instruments Group
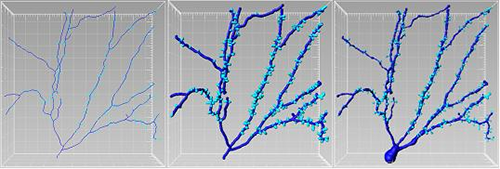
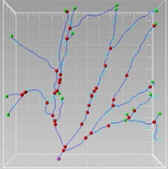
FilamentTracer data can be displayed in a myriad of different ways. This flexibility allows you to best fit your tracings to the specific visualization needs of your audience.
As every researcher knows choosing the most informative visualization method for your data makes your image “worth a thousand words”. The various style, coloring and labeling options in Imaris allow you to display the statistical information generated in FilamentTracer without requiring your audience to read a caption or table to understand the “take home message” of your images
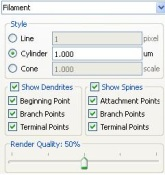
Under the Settings Tab in a Filaments Object, three styles are available to represent your neuronal, vascular or filamentous data:
By default tracings are displayed as Cones at the completion of the Filaments Object Wizard. In this style of tracing each part of the tracing has a specific diameter which is calculated from the image. However, the scale of the Cone diameters can be changed.
If displaying the center path of your tracing is more important than visualizing the diameters and morphologies of your dendrites then the Line style may be a better option for your data. The line width is adjustable in this style as well.
The Cylinder style also represents the tracing at a fixed diameter along the length of the dendrites and spines but tends to have a smoother appearance than the Line style.
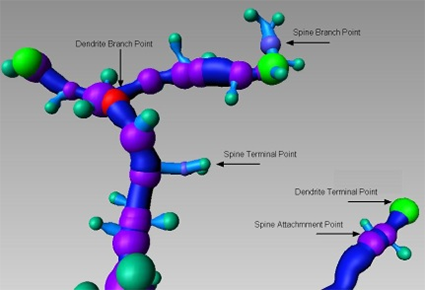
The Settings tab also offers you a way to visualize important landmarks within your tracing. By default Dendrites, Dendrite Beginning Points and Spines are displayed and color coded at the completion of the Filaments Object Wizard. Other important landmarks (i.e. Dendrite Branch Points and Terminal Points, and Spine Attachment, Branch and Terminal Points) can also be visualized as spheres similar to Dendrite Beginning Points. Of course you can choose to hide or display Dendrites, Spines and their landmark points to suit your specific visualization requirements.
Once you have chosen which landmarks to display in your FilamentTracer results you can then color those landmarks to highlight them for your audience.
The options for coloring your tracings are similar to those used in Surfaces and Spots Objects. On the Color tab different RGB colors and transparency percentages can be specified for dendrites, spines and each of their landmark points. With the implementation of Dendrite and Spine tracking, tracks representing dendrite branch and terminal points, and spine attachment, branch and terminal movements over time can also be displayed and colored.
In addition to coloring all your dendrites just one Base color you can also color them based on their specific statistical values. By using the Statistics Coded option you have the ability to pick a statistic of choice and a color map to use for color coding dendrites, spines and their landmarks.
FilamentTracer statistical values can also be placed within 3D space as InPress Annotations.
With all of these visualization options for displaying the original data, the segmented data, and encoding statistics we are sure you will find your optimal combination to produce a figure that is better than a thousand words.

© Oxford Instruments 2026