Applications
 Part of the Oxford Instruments Group
Expand
Collapse
 Part of the Oxford Instruments Group
Severe acute respiratory syndrome coronavirus 2 (SARS-CoV-2) is currently the most well-known member of the large coronavirus family. Coronaviruses are a family of viruses that range from those that cause common cold symptoms through to the more virulent MERS (Middle East Respiratory Syndrome) and SARS (Severe Acute Respiratory Syndrome).
Understanding the unique RNA replication process, defining the mechanism of how coronaviruses cause disease and understanding the host immunopathological response could significantly improve our ability to design vaccines and reduce disease burden (Fehr et al. 2015). Studies can be performed by fluorescently tagging or immunolabelling viral proteins or RNA strands, so it’s possible to image single viruses, or population dynamics during the viral life cycle.
Imaging and visualization of those small viruses (coronavirus is around 125 nm) is on the edge of the resolution limit of conventional light-based microscopy and requires super resolution confocal microscopy techniques (Parveen et al. 2018) and highly sensitive “single-molecule capable” Electron Multiplying CCD (EMCCD) cameras. The images of fluorescently labelled cells in cultures (fixed or live) have been successfully analyzed using the Imaris software platform, which revealed several aspects of the viral infection process.
The combination of advanced light microscopy techniques and Imaris 3D image analysis software lead to several findings which helped researchers understand several aspects of virus-cell interaction.
Virus interactions with the host cell and entry mechanisms
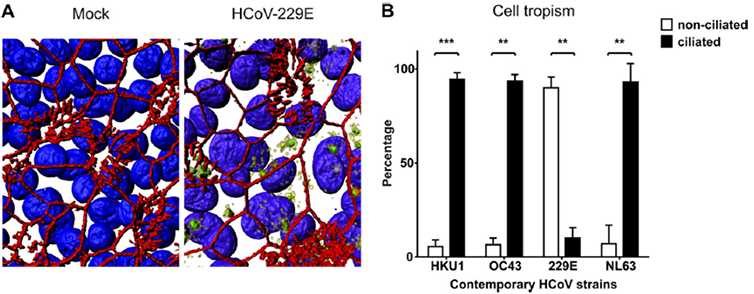
In work by Dijkman et al. in 2013 confocal images were taken of infected cell cultures of human airway epithelium (HAE). The images were analysed using Imaris software. Specifically using 3D surface rendering and colocalization quantifications in Imaris Coloc as shown in Figure 1. The study results have ultimately improved the understanding of virus host interactions.

Quantification of human coronavirus cell tropism. (A) Representative transparent, three-dimensionally rendered z-stack images of HCoV-229E-infected and control HAE cell cultures are shown to illustrate the quantification method for HCoV cell tropism. The cultures were stained with antibodies directed against β-tubulin IV (ciliated cells; red), ZO1 (tight junctions; red), NSP8 (replication complexes; yellow), and dsRNA (viral dsRNA; green) and with DAPI (cell nucleus; blue). (B) Percentages of colocalization of dsRNA with nonciliated (white bars) and ciliated (black bars) cells of four contemporary HCoV strains at 96 hpi. The results are shown as means and SD for 5 randomly selected fields from 2 independent experiments. **, P < 0.01; ***, P < 0.001 (two-tailed, unpaired t test).
Another study shows an analysis of viral infection sites and the entry mechanisms of CoVs, including MERS (Middle East Respiratory Syndrome). Here, colocalization of viral particles with tetraspanin-enriched microdomains (TEMs) was measured using Imaris Coloc Researchers identified TEMs as sites of viral proteolysis, thereby defining subcellular locations of virus priming with greater precision. Implications of these findings extend to the use of virus entry antagonists, such as protease inhibitors, which might be most effective when localized to these microdomains. (Earnest et al. 2015).
Coronavirus replication mechanisms inside the host cell
Study of coronavirus replication mechanism inside the host cell (Muller et al. 2017 ), using Imaris Coloc unrevealed that cytosolic phospholipase 2α (cPLA2) activity is critically involved in the 50 replication of various +RNA virus families and may thus represent a candidate target for 51 broad-spectrum antiviral drug development.
Host immunopathological response to coronavirus infection
In two independent studies conducted in Kehrl’s Lab, Imaris was used to better understand the molecular mechanisms underlying the severe lung pathology that occurs during SARS-CoV (Yue et al. 2018) and how SARS-CoV activates cellular stress pathways and target the innate immune response (Shi et al. 2019). In the studies researchers used Imaris Coloc for colocalization and Imaris Cell to quantify puncta inside the cell.
The ability of Imaris to calculate number of puncta inside multiple nuclei on multiple slides was also used in the study (Ahn et al. 2019) to quantify apoptosis-associated speck-like protein containing a CARD (ASC) specks inside cells in response to both ‘sterile’ stimuli and infection with multiple zoonotic viruses including influenza A virus (−single-stranded (ss) RNA), Melaka virus (PRV3M, double-stranded RNA) and Middle East respiratory syndrome coronavirus (+ssRNA).
The pathways of virus transport and assembly inside the host cell
In another study (Lakdawala et al. 2014), Imaris analysis of microscopy images was used to explore vRNA assembly and transport during a productive infection of influenza virus. The group visualized four distinct vRNA segments within a single cell using fluorescent in situ hybridization (FISH). Imaris Coloc was used to colocalize the vRNA segments within the cytoplasm and Imaris Spots and Surface model was applied to assess distance of the viral foci from cell nucleus.

Imaris was as well used for tracking the cytoplasmic RNA foci inside the cell and creating mean square displacement (MSD) plots.
The public eye is now focused on scientists who are trying to find and test potential candidates for a SARS-Covid-2 vaccine. This research involves a lot of confocal microscopy studies on live and fixed cells. The current state of research demonstrates that, Imaris is a perfect tool for analysis of the data because of its extensive analysis features providing invaluable quantitative information, this is combined with the unique ease of use of the Imaris platform.
Imaris has been mostly used to study the localization and mechanisms of coronavirus infection, replication pathways and mechanisms underlying its influence on the host cell. Images of fluorescently labelled cells in cultures (fixed or live) are acquired with confocal microscopy and analysed with Imaris using mostly: Spots and Surface, quantifying colocalization coefficients (Coloc), calculating the number of puncta inside cells (Imaris Cell), Spots and shortest distance measurements and tracking.
References
