Applications
 Part of the Oxford Instruments Group
Expand
Collapse
Part of the Oxford Instruments Group
This tutorial introduces the Classify Spines XTension. Out of all previously created Spines objects, this XTension determines the differences in spine morphology and classifies them into categories. The quantitative measurement of the spines’ morphological parameters and the spine classification based on these measurements gives information about their functional properties and physiological roles.
Once a Filament tracer creation wizard is completed and the dendrites and spine objects created all the available XTensions are listed under the Tool tab 
As soon as you click on the Classify Spines button, a MATLAB window opens. The Spine classifier window displays a list of four default classes: stubby, mushroom, long/thin, and filopodial.
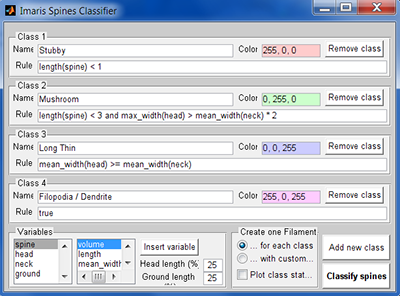
Each class is identified by name, classification rule and color. Classification rules are logic statements written in Matlab and returning a value of 1 if true and 0 if false.

These rules are applied in order of precedence, from top to bottom, as listed in this window.
All spines with a total spine length of less than 1um are classified as according to the first rule. For the remaining spines, the first classification rule is false, and the process of classification continues, by applying the second rule. Any spine that was categorized by the highest rule in the list is excluded from further classification. The new rules are applied when the XTension is executed. To execute it select the Classify spines button  .
.
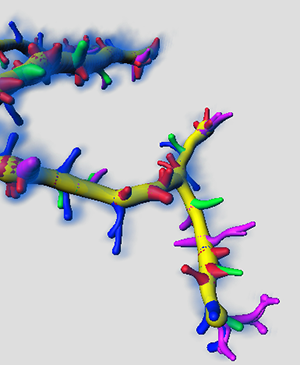
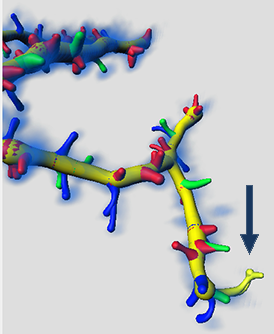
As a result, in the viewing area, the differently coloured groups of Spines are displayed.
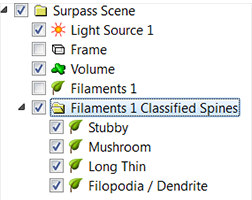
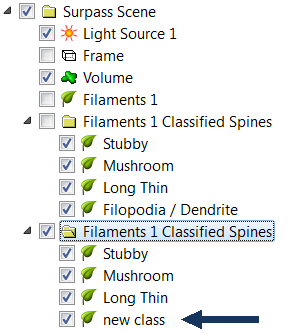
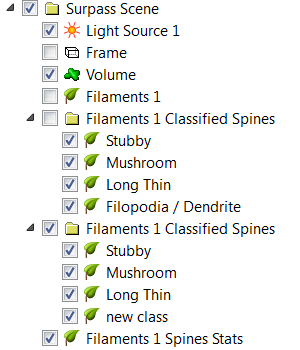
In the Surpass tree, the multifilament Object Group is created. The automatically generated names of the Filaments objects indicate the spine class.
A spine can be classified by using the default rule, or you may create your own classification rule based on your actual data. In the data set, you can select and measure the relevant spine 3D features and use these parameters for setting your own classification rules. You don't need to know how to write the Matlab syntaxes to set a new clarification rule. The default classification rules show the pattern of syntax needed to complete these statements.
By clicking on the rule line, you can edit and customise the current classification rule. Otherwise, you can create a new rule by clicking on the Add new class button
Click on the name line and enter a new name then adjust the colour if necessary. To specify the conditions that the spine objects must meet to be included within the new class, combine the morphological parameters Spine, Head, Neck or Ground with the variables: volume, length, minimum / mean /maximum/width.
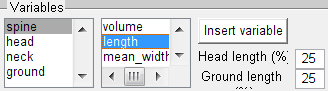
Select the Insert variable button to insert the selected combination of spine morphology and statistical variables.
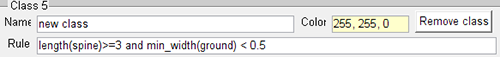
To remove a class, click on the Remove class button.
In this XTension, the total spine length is divided into 3 parts: ground, neck and head. The neck length is set to be 50% and the spine head is 25% of the total spine length. To change the default length ratio enter the new values in the appropriate fields. The new rules will be applied when the XTension is executed.
The newly classified groups of Spines objects are displayed and in the Surpass tree, the new Filaments objects Group is created.
Under the Create One Filament option, you can select the various output options.
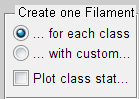
The option Create one Filament object for each class, produces a new multifilament Surpass group and differently coloured Spines in the viewing area.
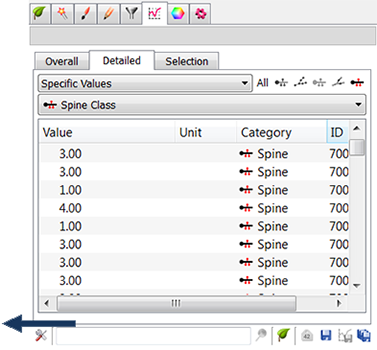
The option Create one Filament with custom statistics, produces one new Filaments object in the Surpass tree. A new statistical variable, Spine class, is added under the Statistical tab. A numerical value of the spine class matches the rule number.
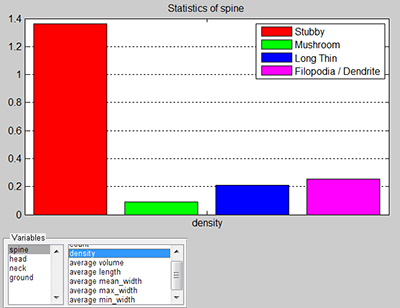
Finally, the option Plot class statistics, produces an additional window with interactive spine statistics plots. For each spine class different variables can be plotted, count, density, average volume, average length, average mean/ min/max for morphological parameters: spine, head, neck and ground. The plot shown, displays spine density for each spine class. It displays the total number of spines divided by the total length of the dendrite.

© Oxford Instruments 2026