Applications
 Part of the Oxford Instruments Group
Expand
Collapse
Part of the Oxford Instruments Group
Application Notes
Published: 10 Feb 2021 · Last updated: 12 Oct 2023
For best 3D/4D visualization, image analysis and interpretation, Imaris promises to visualise your research at the front line of your field.
Imaris systematically shows both complex structural and dynamic data analysis, measures changes in structure over time and provides qualitative and quantitative image information. Here we show these examples:
“ The ‘‘spot object’’ feature of Imaris, which was proven to be the most effective method for particle tracking in asphalt concrete blocks [14], was used to determine the particle movement. ”
Erdem Coleri, John T. Harvey, Kai Yang, John M. Boone Micromechanical investigation of open-graded asphalt friction courses’ rutting mechanisms Construction and Building Materials, Volume 44, July 2013, Pages 25–34
Coleri, E., et al., Investigation of asphalt concrete rutting mechanisms by X-ray computed tomography imaging and micromechanical finite element modeling. Materials and Structures, 2012: p. 1-17
Dr. Erdem Coleri and colleagues, University of California-Davis
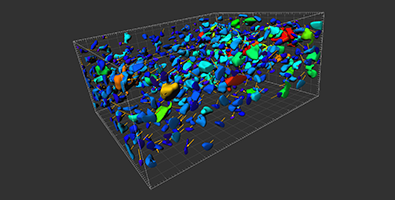
Imaris tracking algorithms were used to evaluate changes in asphalt concrete microstructure under accelerated pavement tests. 3D visualization of X-ray computed tomography image, surface creation and color coding based on aggregates area are used to characterize asphalt concrete microstructure. Distribution of the displacement field of asphalt concrete shown to visualize the general shear and densification related flow under trafficking.
Kotula, P et al Tomographic Spectral Imaging with Multivariate Statistical Analysis: Comprehensive 3D Microanalysis. Microscopy and Microanalysis, Volume 12, 36-48
Dr Paul G. Kotula, Sandia National Laboratories
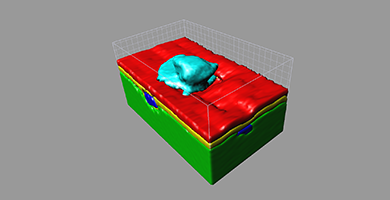
By combining focused ion beam (FIB) with X-ray spectroscopy data and Imaris 3D image reconstruction the smallest defects (corrosion sites and other structural discontinuities) in materials were visualised and analysed. The combination of 3D spectral imaging with comprehensive and multivariate statistical analysis is a powerful method for materials characterization.
Martins, M., et al., In vitro and computational studies of transdermal perfusion of nanoformulations containing a large molecular weight protein. Colloids and Surfaces B: Biointerfaces, 2013. 108(0): p. 271-278
Martins and colleagues, University of Minho, Braga
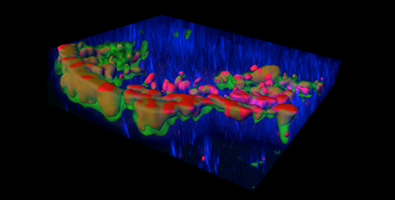
Imaris 3D visualization was used to investigate transdermal perfusion of large hydrophilic molecules. The penetration extent and localization of bovine serum albumin nanodispersions were easily detected by accurate Imaris surface segmentation allowing analysis of lateral diffusion kinetics. The molecular dynamics of nanodispersions of large 66 kDa proteins.
Taniguchi, I., et al., Structural analysis of poly(amidoamine) dendrimer immobilized in crosslinked poly(ethylene glycol). Journal of Polymer Science Part B: Polymer Physics, J. Mater. Chem. A, 2013,1, 14514-14523.
Dr. Ikuo Taniguchi and colleagues, Kyushu University
Imaris was used to analyse the structure of the phase-separation membrane. 2D images of the membrane made of a blend of PAMAM dendrimer immobilized in a PEG dimethacrylate network were processed to create 3D reconstructions of the interface of PEG and the PAMAM dendrimers. Imaris was also used to quantify the volume fractions, interface area, and other characteristics of the phase-separated structure
| Imaris Features & Benefits | |
|---|---|
| 1. Comprehensive insight into complex materials microstructure |
|
| 2. Measurement and analysis of geometric features, size distribution, location for nanoparticles or material surfaces |
|
| 3. Define dendritic architecture of polymers or fibers |
|
| 4. Address your own application needs and evolving requirements. Integrate your MatLab or Phyton custom data analysis applications |
|
| 5. Measure changes over time |
|
| 6. Analyse and present data by comparing structures or movements Enhance the understanding of results and interpret differences |
|
“ I used IMARIS because of its great visualization capabilities for my x-ray CT images and the spot analysis package for automatically identifying and segmenting the particles in my sample. ”
Robert Shepherd, Assistant Professor, Cornell University, Sibley School of Mechanical & Aerospace Engineering
| Relevant Publications | |
|---|---|
| Yin S., et al., Functional Free-Standing Graphene Honeycomb Films, Advanced Functional Materials, 2013 | Pataky, K., et al., Microdrop Printing of Hydrogel Bioinks into 3D Tissue-Like Geometries. Advanced Materials, 2011. |
| Besnard, L., et al., Multiple Emulsions Controlled by Stimuli-Responsive Polymers. Advanced Materials, 2013 | Adelmann, H., B.P. Binks, and R. Mezzenga, Oil Powders and Gels from Particle-Stabilized Emulsions. Langmuir, 2012. 28(3): p. 1694-1697 |
| Nguyen T.H., et al., Observation of the liquid marble morphology using confocal microscopy Chem. Eng. Journal, 2010. 162(1): p. 396-4055. Nguyen T.H., et al., Observation of the liquid marble morphology using confocal microscopy Chem. Eng. Journal, 2010. 162(1): p. 396-405 | Koepplmayr, T., et al., Patterned Immobilization of a Luminescent Ru(II) Complex in Polymer Films Using the Photoreaction of Benzyl thiocyanate: Toward Color Emission Tuning of Electroluminescent Devices. Macromolecular Chemistry and Physics, 2012. 213(4): p. 367-373 |
| Varela JA, Bexiga MG, Åberg C, Simpson JC, Dawson KA. Quantifying size-dependent interactions between fluorescently labeled polystyrene nanoparticles and mammalian cells. J Nanobiotechnology. 2012 24; 10:39 | Ong, L., et al., The effect of pH at renneting on the microstructure, composition and texture of Cheddar cheese. Food Research International, 2012. 48(1): p. 119-130 |
| Shepherd, R.F., et al., Structural evolution of cuboidal granular media. Soft Matter, 2012. 8(17): p. 4795-4801 | Carregal-Romero, E., et al., One-Step Patterning of Hybrid Xerogel Materials for the Fabrication of Disposable Solid-State Light Emitters. ACS Applied Materials & Interfaces, 2012. 4(9): p. 5029-5037 |

© Oxford Instruments 2026