Revealing the specific properties of the objects within your images is a common goal for many Imaris users. However, finding the most significant data by examining the entire set of statistical values can be a difficult task.
Imaris can automatically calculate all available statistical properties for each object in an image. These are the values available for display in the Statistics Tab for each Surpass element (i.e. Surfaces, Spots, Cells and Filaments). To avoid viewing values that are not relevant to your image analysis it may be necessary to modify the display of the statistical table and remove some of the calculated data.
Categories are a quick and easy way to filter the values displayed in the statistical table . A Category identifies, gathers and summaries a set of statistical values associated with only one Object. By summarizing the data distribution using less parameters, you are more likely to generate a statistical table that better meets your analysis needs.
In Imaris, objects are uniquely classified into eighteen (18) Categories according to the Surpass element used to create them. Each Category is represented by an icon, which is found on the right side of the table within the Statistics tab.
The following table presents each Category and associated icon.
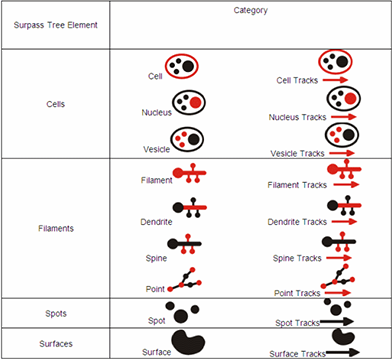
By default, all available Categories are initially active within the Statistics tab. You can change the display by excluding or including Categories. Remember, the Statistics tab display and the available statistical values are based on the Surpass element used to segment the image.
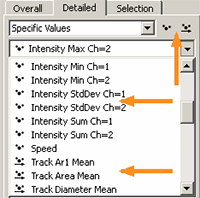
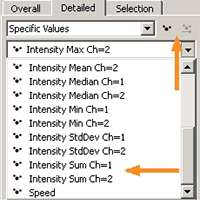
To prevent the inclusion of a specific Category, select the corresponding Category icon. Clicking the icon (e.g Spots Tracks) excludes the corresponding Category values from the statistical table. Now, a restricted list of statistical values is displayed which omits the values of the removed Category. The Category icon is greyed out, as a reminder when those values are removed. Clicking again on the Category icon reselects the Category and adds those values back to the statistical list.
In addition to the Statistics tab, Object Categories can be found on the Filter and Color tabs.
If you have questions about these features mentioned here or other features found within Imaris please contact your local Sales or Support engineer.

