Applications
 Part of the Oxford Instruments Group
Expand
Collapse
 Part of the Oxford Instruments Group
Immunology
Dr. Susanna Celli and colleagues, Dynamics of Immune Responses Unit, Institut Pasteur and the Institut National de la Santé et de la Recherche Médicale (INSERM).
Researchers from Institut Pasteur and INSERM in France, have recently used two photon microscopy and Imaris software to study a mouse model of ear skin transplantation. A better understanding of immune cell migration and the interactions involved in transplant rejection could lead to new ways of controlling the immune response to a transplant.

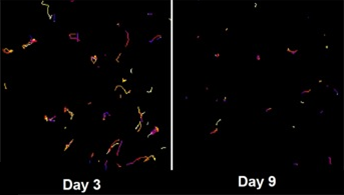
Figure 1 shows trajectories of recipient cells infiltrating the dermis of a skin graft 3 and 9 days after transplant show how the recipient cells that infiltrate the graft after transplant become sessile over time.
The complexity of responses involved in transplant rejection involves studies of inflammatory and antigen-specific components. To get a better picture of how this process occurs in time and space and how the various cellular behaviors influence the destruction of the graft, the researchers developed an ear-skin graft model that can be imaged with intravital two-photon microscopy.
“We dissected the cellular dynamics involved in the rejection of skin transplants,” said Dr. Susanna Celli, who developed this project. “By analyzing data with Imaris software, we were able to visualize inflammatory cells and effector CD8+ T cells inside the grafts and to follow their behavior and interactions.”

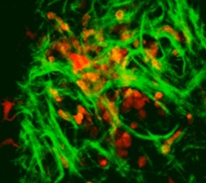
Figure 2 shows the dermis of a skin graft three days after transplant. Recipient infiltrating cells are shown in orange, the dermal donor dendritic cells in red, and collagen in green. Skin from C57BL/6 CD11c YFP male was transplanted into the ear of a C57BL/6 CFP female.
For two-photon imaging of the skin graft, the researchers placed a cover slip with an attached heated metal ring onto the ear of an anesthetized mouse. The ring was filled with water to immerse a 20X, 0.95NA dipping objective. Images were collected every 30 seconds for up to 30 minutes from 5 to 10 z-planes spaced 5 microns apart. The researchers then used Imaris, the most powerful and versatile 3D and 4D image analysis software solution on the market, for 3D reconstruction, object tracking and to calculate cell velocity.

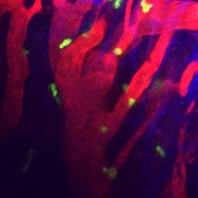
Figure 3 shows blood vessels in the recipient tissue surrounding a skin graft nine days after transplant. CD8+ T cells are shown in yellow, recipient vessels in red, and collagen in blue. Skin from C3H mouse was transplanted into the ear of a C57BL/6 mouse that was adoptively transferred with GFP CD8 T cells.
“In this study it was important to analyze, in detail, the behavior of the immune cells in grafts expressing antigens (allografts) and compare it with the behavior in control grafts without antigens (isograft),” Dr. Celli said. “The 3D reconstruction of the imaged skin graft and their draining lymph node helped us to precisely localize the cells within tissues at any given time point. Tracking and calculating cell velocity allowed us to understand which phases of the rejection required motility and which required stable interactions between the effector cells and their targets.”
The information gained from these experiments and analyses showed that effector CD8+ T cells infiltrate the graft at the dermal epidermal junction. After dissemination in the skin, they stop to exert their cytotoxic activity on target cells. The researchers elucidated several checkpoints of the complex phenomenon of organ rejection, and these findings have potential implications for clinical treatments.
Research Paper: Visualizing the innate and adaptive immune responses underlying allograft rejection by two-photon microscopy, Nature Medicine 17, 744–749 (2011) doi:10.1038/nm.2376.
