Applications
 Part of the Oxford Instruments Group
Expand
Collapse
Part of the Oxford Instruments Group
Case Studies
Author: Alison L. Barth and colleagues, Carnegie Mellon University
Published: 01 Jan 2021 · Last updated: 27 Jul 2022
Tags: neuroscience
To better understand the function of neural circuits on a large scale, Alison L. Barth and colleagues from Carnegie Mellon University are combining Imaris image analysis software with genetically encoded reagents they developed to label postsynaptic sites across a neuron.
“We want to understand how the organization of inputs on a neuron changes during learning or with disease,” said Barth. “The ability to perform a quantitative analysis of how synapses are distributed across large numbers of neurons could provide important insights into how neurons reorganize their networks during important processes.”
Following changes in a network of neurons involves studying their connections in a highly reproducible manner. “This requires very specific criterion for identifying contacts,” explained Barth. “This can be done with Imaris software because it allows specific parameters to be set to consistently detect synapses across different cells in different animals.”
The researchers also needed to trace and render a neuron in three dimensions and then assign specific synaptic puncta to it. “This is not a trivial process, especially when working in three dimensions,” said Barth. “It requires powerful software, such as Imaris, that not only detects specific features but that can also automate that detection.”
Dika Kuljis, the lead researcher in the study, used their new reagents and Imaris analysis workflow by examining the distribution of inhibitory synapses across neurons. There is a wide variety of molecularly defined types of inhibitory GABAergic neurons in the brain. However, the researchers didn’t want to just identify an inhibitory synapse, they also wanted to see where the presynaptic input to that synapse was coming from.
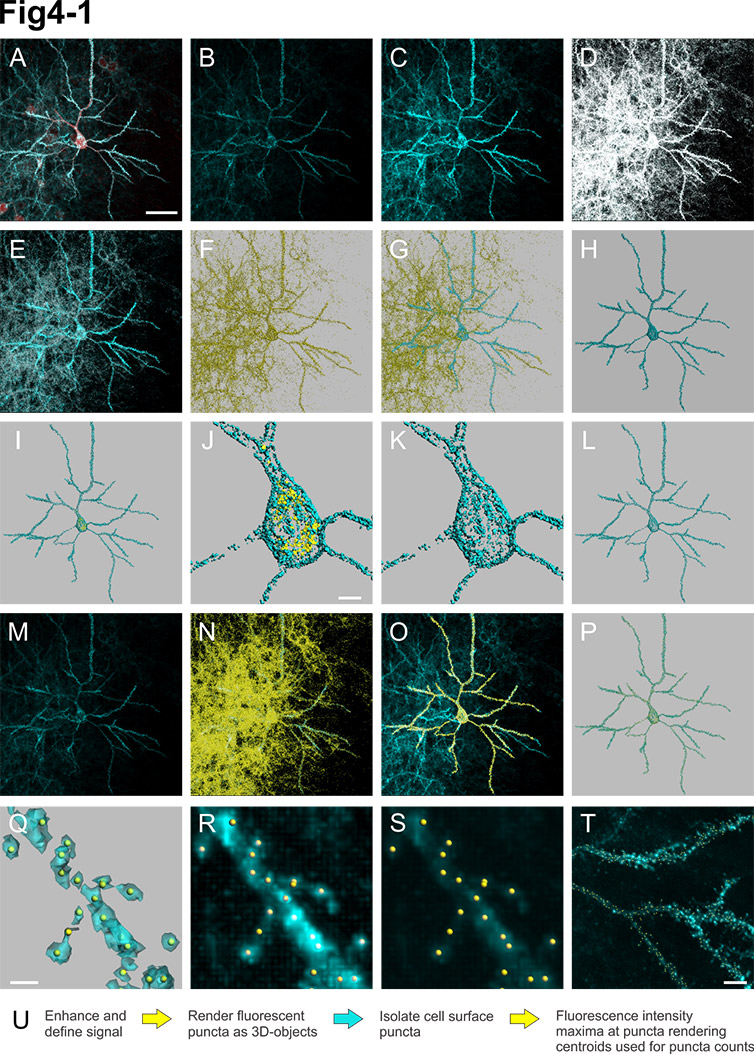
Fluorescent puncta detection method using Imaris. A, Image files imported into Imaris. Scale bar = 40 microns. B, Raw synaptic fluorescent signal. C, Gain-adjusted view of synaptic fluorescent signal to visualize dim YFP signal. D, White mask of synaptic fluorescence differentiates signal from background. E, Puncta creation parameters: 0.5 micron estimated diameter, larger than three voxel size (grey pixels). F, 3D renderings of all fluorescent puncta (yellow). G, Puncta within 0.5 micron from cell surface (edge-to-edge; blue). H, Isolated cell-associated puncta (blue). I, J, Cytoplamic puncta (≤0.5 micron from cell surface; yellow). Scale bar = 5 microns. K, L, Isolated cell-surface puncta. M, Raw synaptic fluorescence used for Imaris spot detection. N, Local fluorescence intensity maxima identified using automatic detection parameters (yellow spots). O, 3D rendering of puncta centers (from L) as spots. P, Q, Alignment of puncta 3D renderings and spots. Scale bar = 1 micron. R, Alignment of spots and signal enhanced fluorescence. S, T, Alignment of spots and raw fluorescence. Scale bar = 5 microns. U, Workflow summary. Courtesy of Alison L. Barth, Carnegie Mellon University.
The researchers performed high-throughput synapse quantitation by using Imaris to render neuralsurfaces then assign puncta to an individual neuron for quantitative analysis. Importantly, they were able to set a specific distance to exclude anything that was too far away from the neuronal process. They used the Imaris Filament Tracer module to create a 3D cell-surface rendering that combined both surface and filament objects. Puncta objects were converted into “spots” using surface object centroids in Imaris.
With this approach, the researchers were able to examine hundreds of cells and see an incredible diversity in how inhibition was distributed across different cells. The analysis revealed parvalbumin inputs as the predominant source of inhibition at both the soma and the dendrites. These were particularly concentrated at the primary apical dendrite, a distribution that hadn’t been observed before, according to Barth. The researchers also used Imaris to create very compelling movies of the cells they studied.
Since performing this work, the researchers have used some of the quantitative information generated by Imaris to participate in a neuro-based hackathon at Carnegie Mellon University. Because Imaris provides information about the size, shape and intensity of the synapses it detects, the researchers wanted to find out if this information might allow them to define synaptic input based upon the fluorescent properties of postsynaptic puncta.
“Because every cell has so many puncta, we could never do this type of analysis by hand,” explained Barth. “During the hackathon, computer scientists crunched the data to see what was distinctive about the morphological appearance of some inputs compared to others.”
For the hackathon, the researchers counted over 150,000 synapses, more than any other study that has been performed in brain tissue. The data analysis revealed that different types of inputs could be distinguished based on their appearance.
The movie shows a layer 5 pyramidal neuron from the juvenile mouse somatosensory cortex, filled with dTomato with FAPpost labeled synapses. Thalamic axons from the posterior-medial nucleus of the thalamus are labeled with CFP. Thalamocortical synapses were digitally identified and rendered to display the distribution of inputs across the dendritic arbor of the pyramidal neuron. Image collected by Dr. Ajit Ray, postdoctoral fellow at Carnegie Mellon University.

© Oxford Instruments 2026