
Applications
 Part of the Oxford Instruments Group
Expand
Collapse
Part of the Oxford Instruments Group
Tutorials
Published: 01 Jan 2012 · Last updated: 10 Feb 2021
Tags: imaris plotting tools
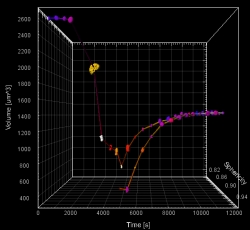
ImarisVantage is a statistical data visualization module that provides a way to display relatively abstract numerical values reflecting relationships between objects. It creates informative, multi-dimensional, dynamic and fully interactive plots that facilitate data understanding by presenting it in insightful visual form. Multiple options for plot creation give you the flexibility to customize your statistical analysis that meets your specific scientific needs and goals.
This section describes the ImarisVantage user interface, and the various components within.
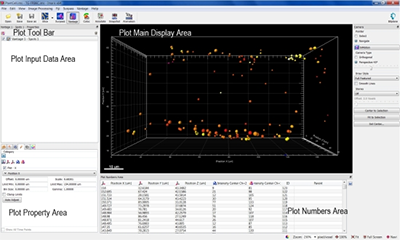
ImarisVantage is built around a workspace consisting of five panels: Plot Tool Bar, Plot Input Data Area, Plot Property Area, Plot Main Display Area and Plot Numbers Area.
Plot Toolbar
Plot Tool Bar contains two icons:  and
and  . Use these icons to add or remove plots from ImarisVantage.
A click on an ImarisVantage icon instantly generates a new entry in the Plot Input Data Area. To create a plot, use Plot Creation Wizard that opens in Plot Properties Area. To remove unfinished or existing plots, click on the icon.
Plot Input Data Area
The Plot Input Data Area displays a list of available input objects for ImarisVantage plots.
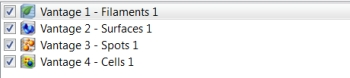
To add a new object to the list of ImarisVantage plots, click on the Vantage icon. When you select a new object, the list is updated and a name is automatically generated for each object. Currently active object is selected and highlighted in the Plot Input Data Area and its properties are displayed in the Plot Property Area. Each Vantage Plot Input Data entry has an associated check box. Check this box to make the plot visible and un-check the box to remove the plotting tools from the Plot Main Display Area.
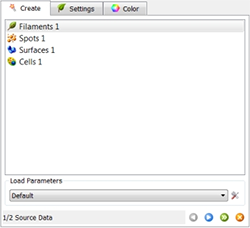
Plot Property Area
In the Properties Area, you can create and modify ImarisVantage plots.
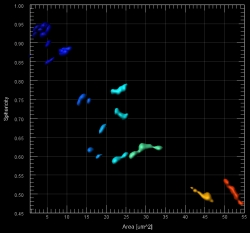
To create a new plot, start with the Plot Creation Wizard. The wizard guides you through the necessary steps of choosing the object, plot type and statistical variable(s) of interest. The plots are highly flexible and can combine up to five statistical variables remapped in the final graph as XYZt, color and scale dimensions.
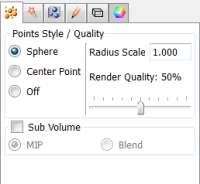
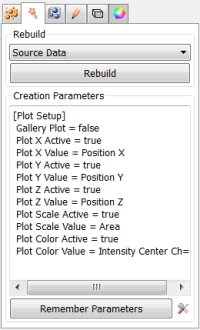
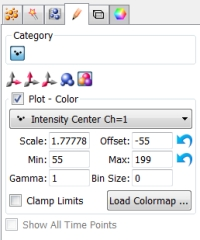
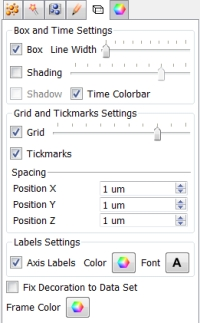
Once the plot is created, you can find all parameters available for the selected plot in the Properties Area. The parameters are grouped under different Parameter Tabs: Setting, Rebuild, Edit, Frame and Color tab.
Plot Main Display Area
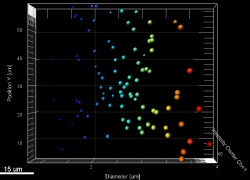
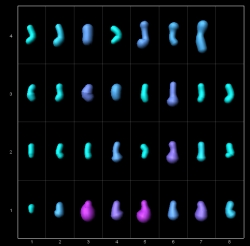
The Plot Main Display Area shows a variety of interactive plots of ImarisVantage providing you a quick and easy overview of your data statistics. Plots are highly interactive and allow you to explore the data in many ways.
Change from the pointer mode to the Select mode and pick the object by clicking on it. Selecting the object in the Vantage plot highlights it in the Surpass mode as well as in the corresponding row of the Plot Numbers Area table. To select a group of objects, press Ctrl+ left click (Mac:Command-left click). You can further examine your data with the pan and zoom functionality.
In addition, the Plot Main Display Area can intelligently arrange multiple plots with simultaneous visualization of the different plot types in the same viewing window.
Plot Numbers Area
The data presented in the Vantage plots are displayed in the table in Plot Numbers Area. The first row contains names and units of the variables, followed by the relevant object information (ID and Parent number). The actual values of statistical variables are listed in columns. You can sort individual columns by clicking on the column heading. You can also click on any individual row of the table to automatically highlight the corresponding object in the ImarisVantage plot. By selecting the Export icon  , all of the data that appears in the Plot Numbers Area will be exported either as Comma Separated Values *.csv, Excel file *.xls, or Excel XML *.xlm files.

© Oxford Instruments 2026