
Applications
 Part of the Oxford Instruments Group
Expand
Collapse
Part of the Oxford Instruments Group
Tutorials
Published: 01 May 2010 · Last updated: 19 Oct 2023
Did you know that you can view the time dependant changes in statistics for each object you have tracked?
If you have an image in 2D or 3D that changes over time:
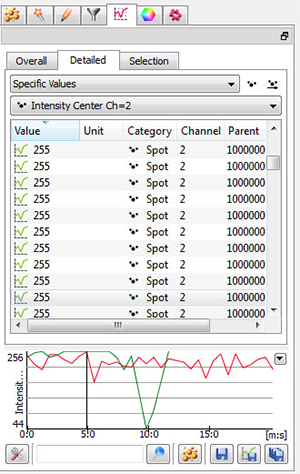
This graph can be used to find time points of interest. Slide the black line in the graph to change time points or use the surpass time slider to change time points...

© Oxford Instruments 2026