Applications
 Part of the Oxford Instruments Group
Expand
Collapse
Part of the Oxford Instruments Group
Case Studies
Author: Hu Zhao, Yating Yi and colleagues, Texas A&M
Published: 10 Feb 2021 · Last updated: 29 Jul 2021
Tags: developmental-biology
Hu Zhao and Yating Yi from Texas A&M along with their colleagues have combined tissue clearing and a new deep imaging approach with Imaris image analysis to study the interface between dental implants and bone. The biological processes at the implant‐tissue interface are critical in how the body integrates the implant into the bone and linked with the success of the implant. Until now, it has been difficult to study these interactions in detail.
Using the new approach, the researchers were able to show that titanium and stainless-steel implants each interact with bone tissue in different ways. This new method for studying tissue‐material interactions will help researchers design better strategies for tissue engineering and regeneration.
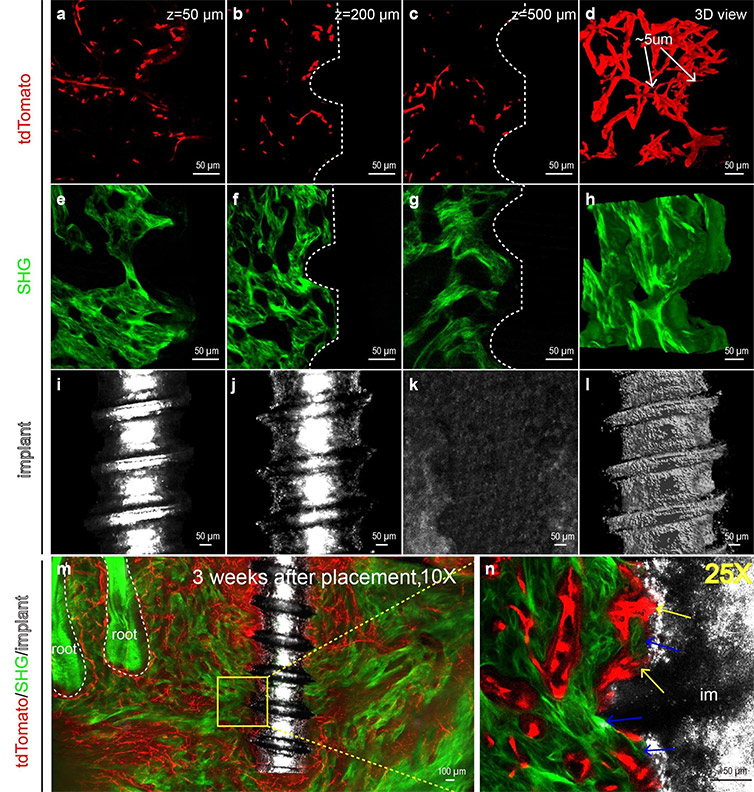
Figure 1. PEGASOS-based deep imaging enables multi-channel imaging of implant-tissue interface with high resolution. Adult Cdh5-CreERT2;Ai4 mice (6 weeks age) were used for titanium implant placement. Mandible samples were processed following PEGASOS method with decalcification treatment. Images were acquired with 25X (working distance 0.57mm) (panels a-l, n) or 10X (working distance 5.2mm) (panels m) objective. (a-c) Optical sections of tdTomato signal displaying blood vessels ( tdTomato) near the implant at the depth of 50μm (a), 200μm (b) or 500μm (c). (d) 3-D view of a 150μm thickness optical stack of tdTomato signal displaying blood vessels near the implant. Arrows show capillaries with the diameter of ~5μm. (e-g) Optical sections of SHG signal displaying bone near implants at the depth of 50μm (e), 200μm(f) or 500μm (g). (h) 3-D view of a 150μm thickness optical stack of SHG signal displaying bone tissue near the implant. (i-k) Optical sections of reflection signal displaying implants at the depth of 50μm (i), 200μm(j) or 500μm (k). No signal was detected at depth of 500μm (k) because the reflection signal could not pass through the radius of the implant. (l) 3-D view of a 150μm thickness optical stack of reflection signal showing the implant. (m) A 400μm thickness optical stack showing a titanium implant within the mandible bone with surrounding vasculature (n) Optical section of boxed area in (m) was acquired with a 25X objective. Yellow arrows show blood vessels in direct contact with the implant surface. Blue arrows indicate direct bone-implant contact. Reprinted from Yi Y et al. Cell Prolif. 52(3):e12578 under CC BY 4.0.
A way to study intact tissue and biomaterial
The new approach uses the tissue clearing technique known as PEGASOS and deep imaging to examine bone-implant interactions in a way that keeps both the tissue and biomaterial intact during the whole process. “This new tool makes it possible to obtain multi-channel images with high resolution,” said Zhao. “These images show the material surface, bone structure, and distribution of certain cells, all at the same time.”
The researchers incorporated Imaris into their image analysis because of its ability to deliver 3D visualization and quantification as well as the fact that it is user-friendly and easy to work with. “The 3D rendering in Imaris, especially mapped color display, proved to be a good way to view the blood vessel structure,” said Zhao. “Surface rendering was also useful for removing the background noise from the reflection light channel so that only the outline of the implants was depicted.”
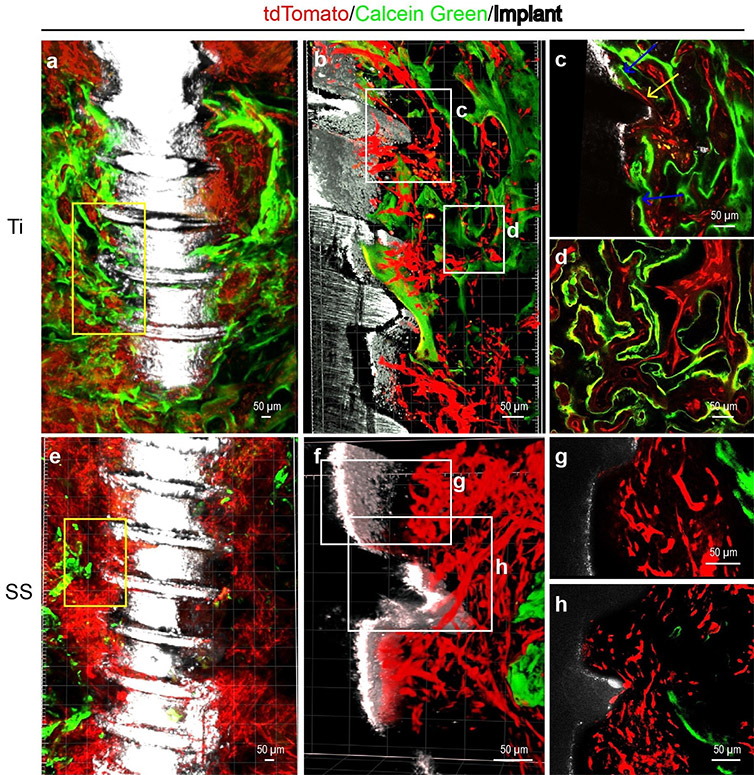
Figure 2. Calcein green labeling indicates distinct calcium precipitation activity at surfaces of stainless steel implants or titanium implants. Adult Cdh5-CreERT2;Ai4 mice (6 weeks age) were used for implant placement and Calcein green labeling. Mandible samples were processed following PEGASOS method without decalcification treatment. Images were acquired with 10X (a and e) or 25X (b, c, d, e, g and h) objective on a two-photon microscope. (a) An optical stack of 150μm showing enriched blood vessels (red) and calcium precipitation activity (green) near titanium implant (white). (b) Boxed area in (a) was re-imaged with a 25X objective.(c) Optical section of boxed area in (b). Yellow arrows show blood vessels in direct contact with the implant surface. Blue arrows indicate calcium deposition at the implant surface. (d) Optical section of boxed area in (b) showing association of angiogenesis and osteogenesis near the implant surface. (e) An optical stack of 150μm showing blood vessels and calcium precipitation activity near the stainless-steel implant. (f) Boxed area in (e) was re-imaged with a 25X objective. (g) Optical section of boxed area in (f) show abundant blood vessels near the stainless-steel implant. (h) Optical section of boxed area in (f) shows sparse calcium precipitation near the stainless-steel implant surface. Reprinted from Yi Y et al. Cell Prolif. 52(3):e12578 under CC BY 4.0.
To acquire multi-channel images, the researchers used a transgenic mouse model expressing Cdh5‐CreERT2 to label vascular endothelium. After clearing with the PEGASOS method, they used either a scanning confocal microscope or inverted two‐photon microscope for image acquisition. The second harmonic generation signal of the bone structure was imaged without the need of extra staining. They also used the reflection light from the 488-nm laser line to view the morphology of implants.
To analyze the images, they began by using the Imaris “Blend” rendering mode with a 3D view to observe the fluorescent signal of blood vessels and the second harmonic generation signal from the bone tissue surrounding the titanium or stainless-steel implants.
Next, they selected an image stack measuring 150 × 150 × 150 microns from the thread grooves of each implant and created Surfaces of blood vessels or bone signals separately based on manually set thresholds in Imaris. Using the statistics function, they obtained the volume information for the signals in each stack. They also calculated the number of direct contact points on each individual optical slice in the stack with a “Slice” window.
Angiogenesis doesn’t always lead to osteogenesis
“The imaging processing and analysis performed with Imaris confirmed that PEGASOS-based deep imaging could help acquire multi-channel images of implant-tissue interface with high resolution,” said Zhao. “We observed that when stainless steel implants were used, angiogenesis progressed normally while osteogenesis progressed more poorly than surrounding titanium implants.”
Overall, the work revealed that although angiogenesis is a known prerequisite for osteogenesis, successful angiogenesis does not always guarantee successful osteogenesis. “We found that various surfaces possess different capability for supporting implant osseointegration,” said Zhao. “This suggests that there might be more intricate mechanisms in regulating angiogenesis-osteogenesis coupling and encourages further research to reveal that mechanism.”
The researchers plan to continue this line of study by using Imaris to study how angiogenesis and osteogenesis are orchestrated around the implant, the relationship between blood vessels and osteogenic progenitors, and the mechanism for regulating the process.
Image analysis with Imaris helped the researchers study the interface between dental implants and bone. The video shows enriched blood vessels and bone with direct contact to the implant interface 1 month after implant placement. Courtesy of Yating Yi, Texas A&M.

© Oxford Instruments 2026