
Applications
 Part of the Oxford Instruments Group
Expand
Collapse
Part of the Oxford Instruments Group
Tutorials
Published: 01 Dec 2012 · Last updated: 19 Oct 2023
Tags: imaris plotting tools
ImarisVantage is a statistical data-visualization module that allows you to understand complex statistical data by uncovering otherwise hidden relationships between objects and identifying patterns and trends.
ImarisVantage creates colorful high-dimensional plots in a way that makes the statistical data more meaningful. The plots are designed to enhance visual and intuitive understanding of the data by combining the numerical and graphical approaches. ImarisVantage lets you generate a hypothesis about the meaning of your data that can be easily tested with the appropriate Vantage plots.
To create a Vantage plot, you must first create a Surpass object. The object statistical data will be used for the plot creation. The statistical values of the object Spots ![]() , Surfaces
, Surfaces ![]() , Cell
, Cell ![]() , and Filaments
, and Filaments ![]() could be used to create the Vantage plots.
could be used to create the Vantage plots.
To start ImarisVantage creation wizard follow these steps:
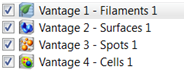
The wizard shows a list of all available input components for ImarisVantage plots.
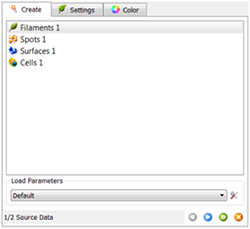
Select one of the input components from the list (Spots, Surfaces, Cells, or Filaments). In the next step of the Creation Wizard, specify the plot type that you want to use. ImarisVantage lets you choose four different plot types.
XYZ |
Gallery |
Time Plot |
Scatter Plot |
Once you have determined what plot type you want to use, several predetermined subtypes are available based on the number of assigned plot dimensions. Under the Plot Values, all available plot dimensions are listed.
|
X |
Y  |
Z |
Scale |
Colour  |
For each plot dimension, the drop-down list offers a set of available statistical variables for the selected object category.
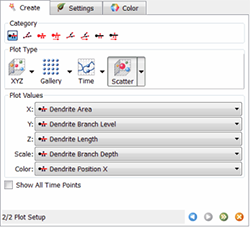
To select the statistical variable to be assigned to the chosen plot dimension, click on its name and the selected variable will be automatically assigned.
Click on the Finish button and the Vantage plot is displayed in the viewing area. The plots characteristics are directly linked to the selected statistical variables. The collection of plots arrangements is limitless, letting you visualize, manage and analyze multi-dimensional data objects efficiently in one application.
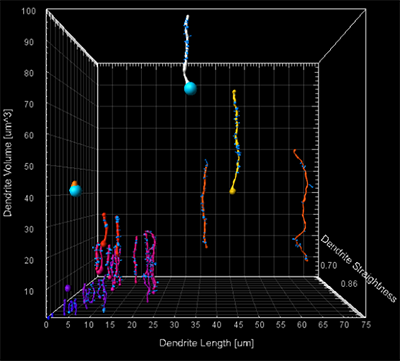
Image above: Pyramidal Cell
Scatter plot
X plot dimension: Dendrite Length
Y plot dimension: Dendrite Volume
Z plot dimension: Dendrite Straightness
Color plot dimension: Dendrite Volume
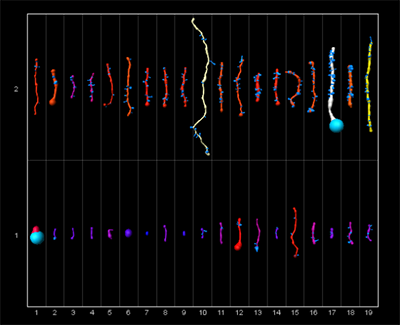
Image above: Pyramidal Cell
Gallery plot
Sorted by: Dendrite No of Spines
Color plot dimension: Dendrite Area
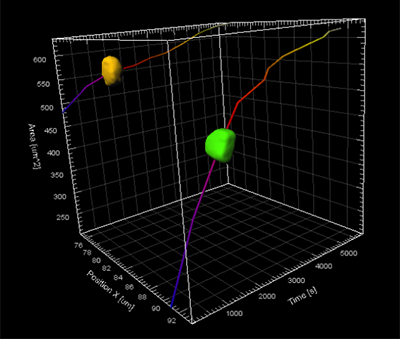
Image above: HeLa Cell
Time plots
X plot dimension: Time
Y plot dimension: Area
Z plot dimension: Position X
Scale plot dimension: Speed
Color plot dimension: Sphericity
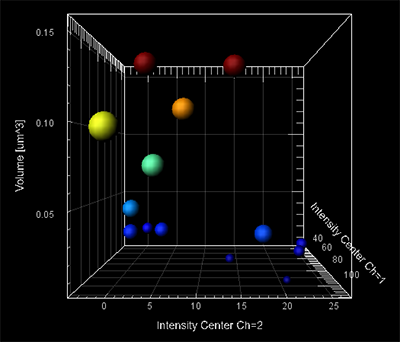
Image above: PtK2Cell
Scatter plot
Intensity Center Ch2
Y plot dimension: Volume
Z plot dimension: Intensity Center Ch1
Color plot dimension: Volume
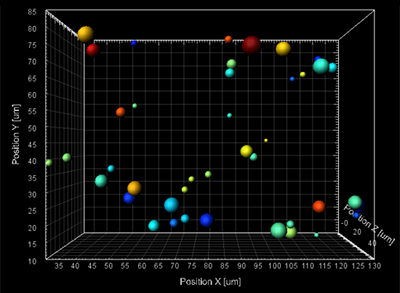
Image above: Plant Cell
XYZ plots
X plot dimension: Position X
Y plot dimension: Position Y
Z plot dimension: Position Z
Scale plot dimension: Intensity Center Ch2
Color plot dimension: Area
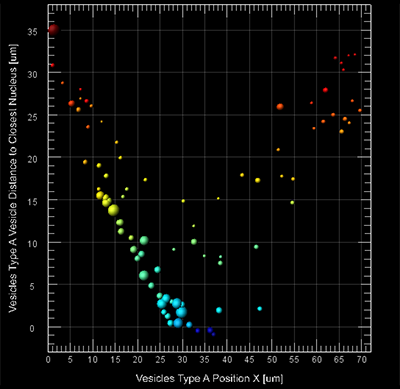
Image above: Cell demo
Scatter plot
X plot dimension: Vesicle Type A Position X
Y plot dimension: Vesicle Type A Vesicle Distance to Closest Nucleus
Scale plot dimension: Vesicle Type A Intensity Max Ch3
Color plot dimension: Type A Vesicle Distance to Closest Nucleus

© Oxford Instruments 2026