Applications
 Part of the Oxford Instruments Group
Expand
Collapse
 Part of the Oxford Instruments Group
This short tutorial will familiarize you with more options for modifying an ImarisVantage plot. You may watch the tutorial video (click to enlarge) or read through the instructions further below.
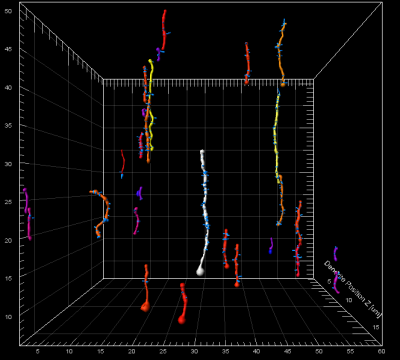
Following the plot’s creation, the objects’ size and orientation are automatically determined to provide the best plot display. This is determined by the number of selected plot dimensions, the values of the chosen statistical variables and the number of objects being visualized.
The View tab offers you several ways to customize the object display manually by adjusting and modifying many display settings of the created plot. In the View tab, you can adjust the relative size of the objects, their orientation as well as their alignment. (Fig. 1)
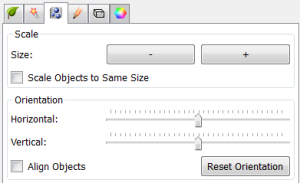
The size of an object in an ImarisVantage plot can be altered using the Minus and Plus buttons. Pressing these buttons changes the objects’ size within the View Area, by simultaneously changing the Scale values for the X, Y and Z dimensions of the plot. Every time the Minus button is pressed the size of the object is reduced by 10%. Similarly, by using the Plus button, the objects are enlarged by 10%.
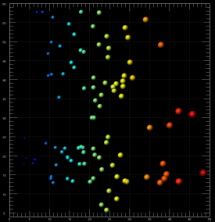
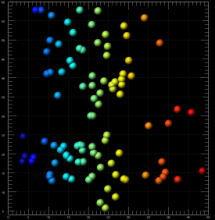
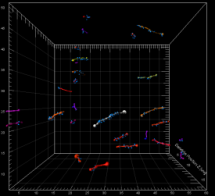
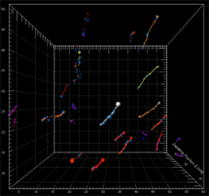
The Scale option can be used to map all objects with uniform size distribution irrespective of their original sizes. By selecting the Scale Objects to Same Size option, all objects within the plot area are scaled to the largest object. (Fig. 2 & Fig. 3)
There are several options that affect how objects are oriented in an ImarisVantage plot. You can manipulate the object by rotating it and thus changing its initial axial position. These options allow you quickly to change the viewing orientation of an object, making it possible to view it from all sides. To rotate the objects either horizontally or vertically you can use the respective sliders. Effects of rotation are shown in Fig. 4 & Fig. 5 below.
The original orientation of the objects can be restored by selecting the Reset Orientation button. When working with the XYZ, Time or Scatter ImarisVantage plots, you may find that objects are not always aligned. The option Align Objects allows you to align objects vertically relative to each other. (Fig. 6)
