Applications
 Part of the Oxford Instruments Group
Expand
Collapse
Part of the Oxford Instruments Group
Tutorials
Published: 10 Feb 2021 · Last updated: 10 Feb 2021
Tags: customizing imaris functionality with xt
June 2014
This tutorial introduces the Spots to Spots Closest Distance Xtension. This XTension calculates and displays the distance to the closest neighbor of the Spots objects. The result of this XTension could be particularly useful for stem cell and tissue research, morphogenesis, cancer progression or biofilm development studies in which quantification of distance can reveal some unique spatial relationships.
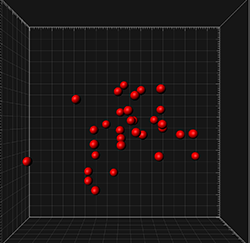
We will start at the point where the Spots creation wizard has been completed and Spots objects created.
All the available XTensions for Spots are listed under the Tool tab  .
.
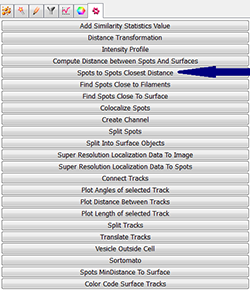
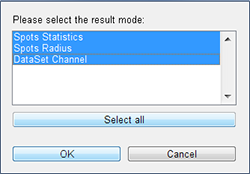
As soon as you click on the Spots Closest Distance button, a MATLAB window opens. There are three different possibilities of how the results can be displayed:
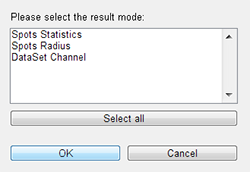
Spots Statistic
If you select the Spots Statistic option a set of new statistical variables is added under the Statistics tab. A new Spots object is created and under the Statistics tab  , Detailed tab, in the Specific Values, three new types of distance measurements are available: Maximal, Mean and Minimal distance.
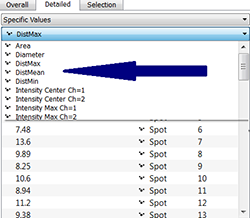
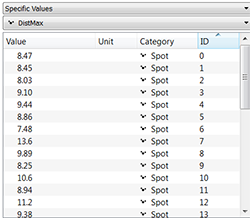
Click directly on the object of interest and the corresponding row of the table is highlighted. To find all statistical values only for the selected object or group of objects choose the Selection tab.
Spots Radius
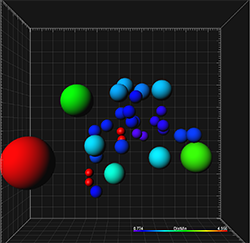
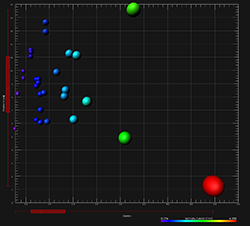
If you select the Spots Radius option and start from all spots that are the same size as in this tutorial, after running this extension, a new spots object is created and the distance value is encoded to the spots radius.
As distance to the next spot is represented as a radius, you can have a fast visual indication of where spots are close together and where they are further apart. The bigger the radius, the greater the distance from another spot.
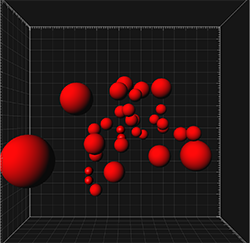
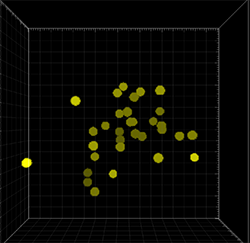
Also under the Statistics tab, you can find the radius value for each newly created spot. These values represent the distance to the next spot object. To further enhance the visualization you can color code the spots based on diameter.
And now the image shows the same value represented both in color and size
DataSet Channel
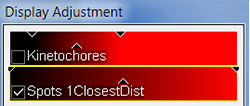
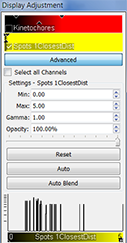
Lastly, if you select the DataSet Channel option, the distance values are encoded in the newly created channel intensities. A new channel has been added to the Display adjustment window.
All intensities outside spots objects are set to zero and intensities inside spots have a value of the distance to the next spot. This new channel can be also used in visualization if its range is exaggerated and the color is and gamma value is adjusted.
Under the Statistical tab, a new statistical variable shows the intensity center of the newly created channel indicating the distance to the next spot.
A possibility of multiple results is available by pressing the Select All button.
The next step is to decide how the distance calculation is to be performed.
Distance Calculation Mode
The distance can be calculated either from the Centre of the spot object or from the Border.
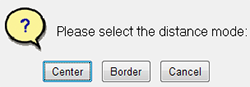
The option to calculate the distance from the border is useful if you have already created some multiple size spots objects. Then this XTension will calculate the distance between edges of objects. In other cases, measurements between object centers might be more suitable. All previously shown examples were based on measurements between objects centers.
If you have questions about these features or any other features found within Imaris, please contact our Sales or Support team.

© Oxford Instruments 2026