Applications
 Part of the Oxford Instruments Group
Expand
Collapse
Part of the Oxford Instruments Group
Welcome to the Imaris 9.7 release notes. Please have a look to the overview of Imaris Release notes for information about prior released features and fixed bugs.
Version Date: February 9, 2021
Imaris 9.7 addresses two themes: Dynamics and Structure. New measurements and new plots provide useful information and analysis.
Imaris 9.7 facilitates the investigation of dynamics of individual cells by providing an easy mechanism to synchronize measurements from an entire population based on “events” independently defined for each cell. For example in a movie of dividing cells where divisions happen at different time points one can define an event for a cell when it undergoes cell division and then plot measurements synchronized by their time relative to the event.
Imaris 9.7 lets users address an important question: “Is there an interaction (spatial relationship) between spots and surfaces?” To answer this question Imaris computes the number of spots within a distance d of the surface as a function of the distance and compares the observed function with simulations of spots positioned under complete spatial randomness. Using this approach from spatial statistics users can study interactions between spots and surfaces.
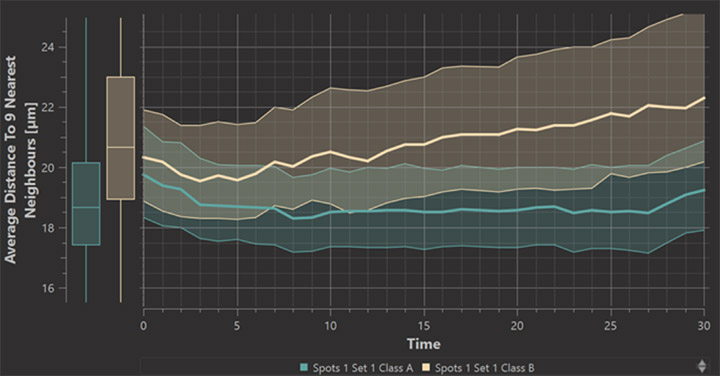
For the study of dynamical phenomena we have added a Time plot to the Vantage module. It plots statistics values measured by surpass objects, i.e. spots, surfaces, cells, or filaments. The plot shows median values as well as 25 and 75 percent quantiles over time and it lets you easily set up a comparison between different surpass objects or between different classes in a single surpass object.
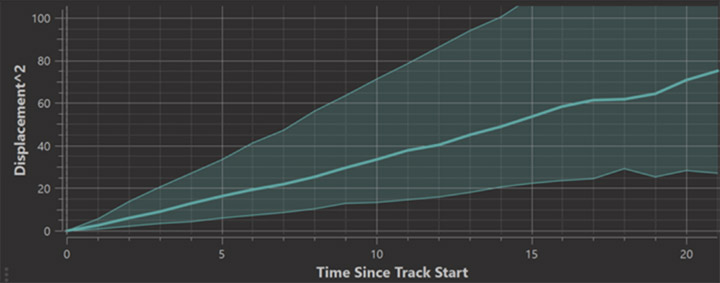
When objects are tracked Imaris automatically records “Time Since Track Start” statistics values. In the Vantage Time Plot you can choose this time as the x-axis to for example produce an MSD plot (mean squared displacement plot).
Other choices for the time axis come from the definition of events. For example when cells are tracked with the lineage tracking algorithm every cell division creates an event and this leads to time statistics called “Event Time Event = TrackSplit” which Imaris computes to enable plotting of statistics values around the time of cell division.
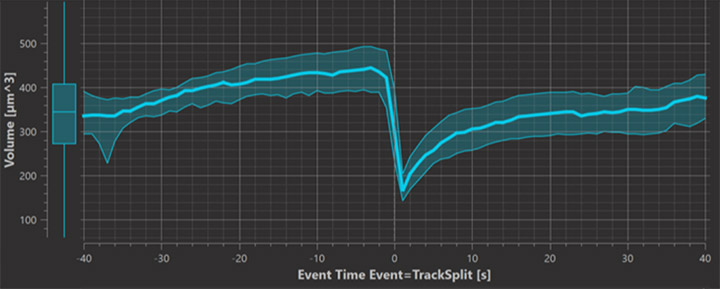
This plot shows the volume occupied by chromosomes before and after mitosis. To get a graph like this from many cells that divide at different time points it is essential to synchronize all measurements by their time relative to the event which is captured in the “Event Time Event=TrackSplit” statistics. Imaris 9.7 produces this measurement automatically.
Imaris 9.7 introduces the concept of “events” to allow alignment of time series data by “events” on the time axis. Consider as an example three cells in the same image undergoing mitosis at different times, as shown in figure 1c. The graph in Figure 1a shows the intensity of the DAPI channel of the three cells plotted against acquisition time. Figure 1b shows the same graphs after aligning them by the events indicated on the time axis of Figure 1a.
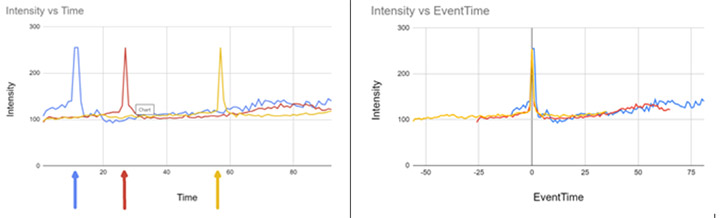
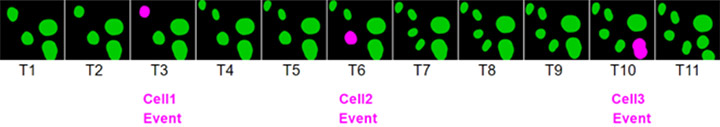
Figure 1. Intensity of DAPI in three cells undergoing mitosis. a) Intensity plot versus acquisition time. b) Intensity plot against “EventTime” after defining events at the peak of chromosome condensation for each cell individually. c) Time series with the cell events indicated in pink.
Events can be defined in the creation wizard of Spots or Surfaces. To do so one has to first classify objects into different classes and then one can set up “ClassChange” events for objects within a track when they “switch” from one class to another. This approach may seem somewhat indirect but it comes with the benefit of unlocking all the possibilities of the classification tools for the definition of events.
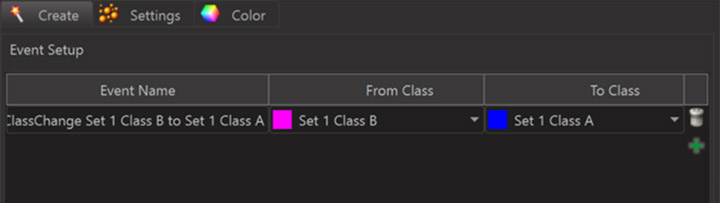
The event setup dialog lets you add any number of events and for each event you can define the class-change you are interested in. For example you may have set up an “inside” and an “outside” class based on the shortest distance between spots and surfaces to label spots as “inside” when their distance to the surface is negative and “outside” otherwise. You can then set up an event to capture when a spot changes from “outside” to “inside” and another event for when it changes from “inside” to “outside”. Each event you define produces a corresponding event time statistics for all those objects that are in a track which has such an event. This statistics value then becomes available as an x-axis for the Vantage Time plots.
When objects are tracked in such a way that tracks divide or merge --- through lineage tracking or connected components tracking or maximum overlapping cells or manual tracking --- then the objects immediately before a division or immediately after a merge will get a TrackSplit or TrackMerge Event and for all objects within a track that has a division or a merge an event time “Event Time Event= TrackSplit” will be computed.
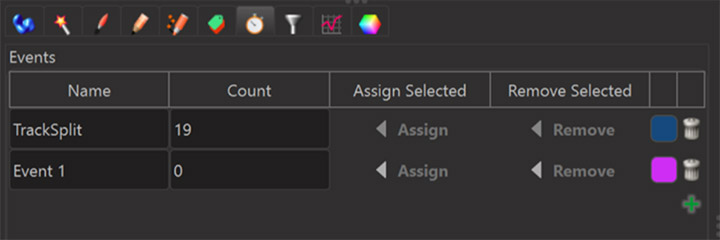
Events can be manually edited after object creation in the “Edit Events” tab. To assign an event to an object, select the object and press “assign” on the event you want to assign to that object.
It is also possible in Imaris 9.7 to add “Image Events” to some time points of a time series image. These will also lead to event time statistics for Spots and Surfaces and Cells and Filaments so that again those event time statistics can be used as the time axis in Vantage Time.
To set up image events the time bar of Imaris has received an event toggle button that adds an event at the current time point if the current time point doesn’t already have an event. In case the current time point has an event the event toggle button removes the event from the current time point.

Existing image events are rendered on the time axis as yellow rectangles.
When Events are defined for objects in a track Imaris 9.7 will automatically compute some new statistics for each object in the track.
| TimeSinceEvent | Time since nearest previous Event. Before the first Event it has negative values. |
| TimeToEvent | Time to nearest next Event. After the last Event it has negative values. |
| EventTime | if(TimeSinceEvent < TimeToEvent) {
} |
EventTime is computed for the purpose of plotting statistics “around the event”. It’s definition is somewhat arbitrary but it often fulfills the purpose of plotting statistics “around the event” quite well.
To help study the relation between two sets of surfaces Imaris 9.7 calculates statistics values measuring surface-surface overlap.
Imaris 9.7 provides some useful tools to study the question: “Is there an interaction between spots and surfaces?” and the follow up question: “At what distances do we observe attraction/repulsion?”
The starting point of this analysis is the measurement of the cumulative number of spots within a distance d from the surface and its less reliable1 counterpart the number of spots at a distance d from the surface.
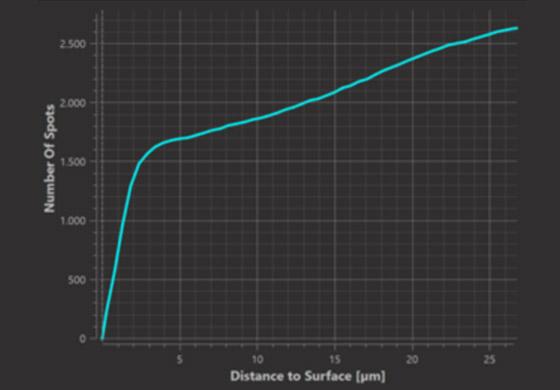
Cumulative Plot (within distance d)
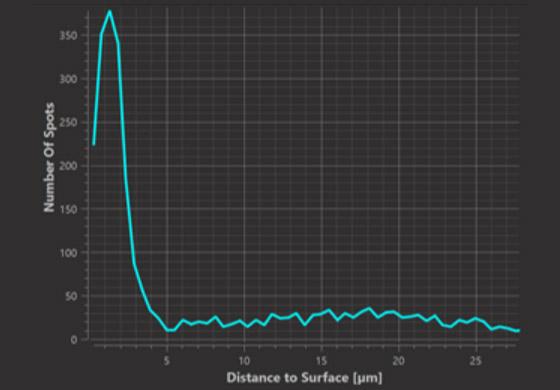
Histogram Plot (at distance d)
Imaris 9.7 then simulates randomly positioned spots (the same number as observed) and generates a randomization envelope around the expected value of the simulations. This facilitates a useful comparison. Since the simulated spots are by construction neither attracted nor repelled from the surface they provide a useful null hypothesis and deviations from this null hypothesis indicate attraction or repulsion.
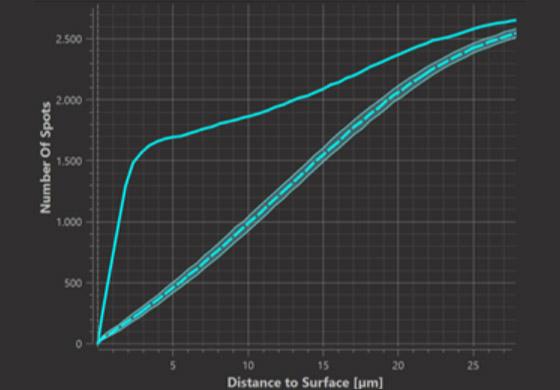
Cumulative Plot (within distance d)
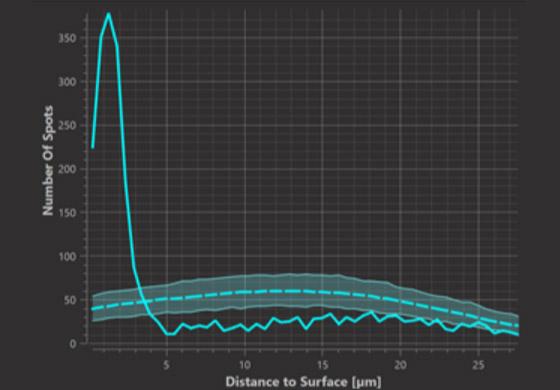
Histogram Plot (at distance d)
Inference from the cumulative graphs
Where the observed cumulative function exceeds the simulations it indicates “attraction” or more plainly that the observed number of spots within the respective distance to the surface is greater than what is expected from random simulations. Where the observed cumulative function is lower than the simulations it indicates “repulsion” or more plainly that the observed number of spots within the respective distance to the surface is lower than what is expected from random simulations.
Inference from the histogram graph
In the histogram graph we can observe at which distances from the surface spots occur in greater or lesser numbers than expected from random positioning. In the example it is at distances up to 3.5 micrometers from the surface that we observe a greater number of spots than expected from random positioning.
The probability density graph
The probability density graph is similar to the histogram graph in that it represents that density of spots at a distance from the surface. This graph is more smooth than the histogram because it is constructed using a kernel density estimate. The kernel smoothing is also applied to both the observed data and the simulated data (following [Duranton 2005]). The kernel width is displayed in the legend of the graph.
Randomization Envelope
The randomization envelope of the random spots is computed from 1000 simulations such that it encloses 98% of the simulations, 1% of the simulations were above the randomization envelope, and 1% below the randomization envelope. It is plausible to reject the hypothesis that observations are completely random when the observed curve lies outside of the randomization envelope.
Simulation Regions
Please take care to understand that the region for the simulation of random spots forms the basis for inference. It is deviations from complete spatial randomness in the simulation region that you can detect with the plots of Imaris9.7. Imaris9.7 provides 3 choices for the region within which random spots are simulated: Inside the surface, outside the surface or inside- and outside of the surface. Furthermore Imaris9.7 will automatically restrict the distance from the surface (outside and inside) within which spots are simulated to the distance that is displayed on the x-axis of each plot.
To visualize the region within which random spots are simulated you can use the Surface distance transform function (see below) to compute a distance transform from the surface and consider only distances in the range that is displayed on the x-axis.
The methods employed by Imaris 9.7 are based on well-established methods from the field of spatial statistics. In statistical terminology Imaris9.7 plots the “intensity” of the observed spots as a function of the shortest distance to the surface [Baddeley 2015 chapter 6.6]. In [Baddeley 2015 chapter 10] you can find a description of randomization envelopes and hypothesis tests. When building the methods for Imaris 9.7 the analysis of [Gomariz 2018] served as a model.
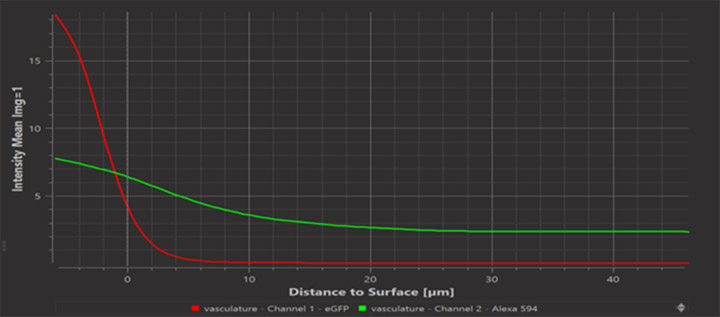
Imaris 9.7 provides a plot showing the average image intensity of each image channel versus distance d from the surface. This plot lets you inspect whether the intensities in some channel change as a function of distance from the surface. Clearly we expect this for the channel from which the surface was computed. You may find that other channels also exhibit a change of intensity with distance.
Via the “Mask Selection” or “Mask All” buttons on the Surfaces Edit dialog it is now possible to compute the Distance Transform. The result is a new floating point image with a channel that holds at each voxel the value for the shortest distance to the surface from the center of that voxel. The distance is computed inside and outside of the surfaces. The values of the Distance Transform inside the surfaces will be negative.
The computation of an identifier for the computer on which a license is installed has been improved for Imaris9.7. Where previously users had to choose a HostId, Imaris now automatically computes a unique ID and no user choice is required.
Click here for instructions on how to update your license.
We want to thank Alvaro Gomariz and César Nombela-Arrieta for their support and for the discussions about spatial statistics and its use in Imaris.
| 84 Bugs Fixed in Imaris 9.7 | |
| 10010 | Hard to determine which license is selected in Administrator - Replace QTableView with QTreeView in Imaris Administrator |
| 10740 | AddFilaments() in Imaris 9.1.x works like SetFilament() previously, i.e. deletes the current Filament |
| 10757 | OME Tiff files from Micromanager (1.4.23) does not get converted |
| 10846 | Edit Surfaces step of creation wizard is non-functional |
| 10849 | some .lsm files open with incorrect intensity values |
| 11408 | 2D tiles of ND files are not correctly read in but superimposed |
| 11472 | Help for XTension Surfaces Split misleading |
| 11659 | Formula % of data set colocalized wrong |
| 11774 | Observed Folder Lists and Observed Folders can be lost when Imaris and ImarisViewer are opened at the same time |
| 11794 | XT Classify Spine is broken if there are more than two separate dendrite |
| 11798 | Statistics calculation happens too often while moving the frame |
| 11801 | Imaris crashes when saving this file |
| 11851 | Support Phase View Light Sheet Data Format |
| 11916 | Measurement Objects change mouse zoom behavior dramatically |
| 11929 | Measurement points are not placed exactly on surface of surface objects |
| 11940 | After creation of reference frame statistics are not displayed |
| 11972 | Imaris crashes when performing Rebuild Surfaces/Finish on PlantCell_with_objects.ims |
| 12011 | Manders' in Coloc Module has incorrect spelling |
| 12012 | Imaris Crashed When Trying to Change the Mapped Color of a New Channel Resulted from Channel Arithmetic of Ratio Two Channels |
| 12021 | Vantage full screen crash |
| 12043 | Imaris crashes when importing invalid ims file |
| 12065 | Tracks: Color Type > Statistics Coded > Advanced configuration doesn't have any effect |
| 12085 | Multi-image with no overlap results in incorrect Cell intensity statistics |
| 12086 | Imaris fails to convert these .tiff images |
| 12114 | Scalebar is showing wrong values if Snapshot size in 'Fixed' size mode is changed |
| 12120 | Imaris crashes on extract channel |
| 12124 | 'Add Image' with customer data set changes the voxel size of the already loaded file |
| 12137 | OIF datasets with µ in name can not be opened |
| 12161 | Material Editor for Filament Points still contains "Diffusion/Specular/Emission" checkboxes |
| 12174 | Information about the Spots Quality filter is missing from the reference manual |
| 12202 | In Batch Setup, the mouse cursor does not change to indicate scalebar modification possibilites |
| 12210 | Help – About Imaris not immediately displayed |
| 12227 | ome tiff time interval is wrong |
| 12232 | Incorrect ome tiff file conversion |
| 12235 | Black stripes appear in the masked channel |
| 12269 | Channel visibility is not stored on "Save" |
| 12271 | Multi-image Surface ROI shows volume highlight in the wrong image |
| 12278 | Cannot hide channels in Batch Surface Creation in Slicer View |
| 12296 | Cannot close the preferences window |
| 12304 | Arrow keys do not function correctly when contour tracing |
| 12318 | No Context Help available when clicking in large empty space below Stitcher Preference License Dialog |
| 12325 | Object color in track editor didn't change with color tab |
| 12326 | Snapshot in track editor can't export a normal image |
| 12330 | Extract channel does not work on wasp image |
| 12334 | File Converter log file missing |
| 12335 | On MAC, installer buttons are white when using Dark Mode |
| 12340 | Need axis labels on the Filter 2D Classification step in creation wizard. |
| 12343 | 'Camera' panel has no name when in tabbed view with Annotate |
| 12354 | Check mark 'Labels overriding base color' does not remember status |
| 12365 | XTensions do not start. Fatal error loading library ... mclbase.dll |
| 12372 | Crash when going back and forth between step Threshold and Filter Seed Points |
| 12387 | User-set data cache and number of threads are ignored |
| 12390 | Imaris 9.6.0 Programming Interface page title shows 9.7 |
| 12395 | Imaris crashes when editing seed points and using volume preview |
| 12396 | Circle select doesn't work for 2D cells with nuclei |
| 12399 | Automatic reset of Display Adjustment position if off screen in all cases |
| 12401 | Surface - split using seed points broken - generating overlap |
| 12405 | Stitcher license dialogue reports 'Connection Failed!' |
| 12406 | select Coloc tab with 150% or higher windows scaling crashes Imaris |
| 12418 | overall statistics does not have Set and Class name |
| 12424 | Masking the Surface Export of ImarisCell fails with 2D image |
| 12429 | File open error with Scene for an IMS file - Could not load scene. bpTimes::FindTimeBegin(…) - IdTimeBegin 0 doesn’t exist.” |
| 12430 | Surface mask is not accurate in Imaris 9.6 |
| 12445 | nd2 files fail to convert correctly |
| 12447 | Machine Learning Classification crashes Imaris in this image. |
| 12452 | Native Distance calculation crashes on this image |
| 12455 | Could not write File - Error when pressing 'Save' after drift correction |
| 12458 | Improve description of Memory and Data cache preferences |
| 12460 | Editing surfaces tracks crashes sometimes |
| 12461 | ImageJ TIFF second channel not read correctly - filled with zeros |
| 12464 | Anyone can use Vantage from "Plot" of Arena |
| 12471 | Missing MSVCR120.dll when installing Viewer 9.6 |
| 12481 | No valid license dialog shows up 4 times |
| 12502 | Importing scene (with add components option) from same image creates correlation between duplicated components |
| 12511 | Imaris doesn't recognize .ims file converted from .tif since 9.6.0 |
| 12520 | ICS2 file cannot be converted/loaded by Imaris 9.6 |
| 12543 | 9.6 reference manual, section2.9 is for old version vantage explanation |
| 12545 | Setting the Date/Time and Format in Windows to anything else other than English will cause issues in Wizards entering numbers with decimal point |
| 12592 | Topic id for Animation - Custom Rotation dialog is wrong |
| 12611 | Imaris freezes when showing Spots Average Statistics and changing time point |
| 12634 | Drift correction in 9.6 and 9.7 beta no longer works compared to 9.5.1 |
| 12644 | "Channel extract” on 2D dataset crashes randomly |
| 12653 | XT ImarisApplication.SaveSnapShot() does not work |
| 12673 | 'RIGHT MOUSE - Show Help' link broken for 'Preferences - Statistical Tests' |
| Fixed 4 Bugs (since Imaris 9.7.0) | |
| 12703 | Changing time point causes crash |
| 12736 | Imaris on VM cannot be run using a float license server |
| 12741 | Cannot issue licenses because of an empty HostID even if Imaris has a valid MAC address |
| 12716 | Observed list displayed in Arena is not preserved when Imaris is shut down - reverts back to demo folder |
| Fixed 11 Bugs (since Imaris 9.7.1) | |
| 12406 | Select Coloc tab with 150% or higher windows scaling crashes |
| 12460 | Editing surfaces tracks crashes sometimes |
| 12697 | Clicking the Color tab causes resizing problems |
| 12701 | Surpass tab vertical resizing |
| 12712 | Display Adjustment is confused in multi-image files |
| 12715 | Older ImarisViewer versions show that there is a new version but the release notes are empty |
| 12727 | Entering Numbers in the Wizards with fractions is buggy and inconsistent |
| 12729 | Hard crash when switching from 'Selection' to 'Detailed' in Measurement Points |
| 12732 | Export volume statistics from timelapse image crashes Imaris |
| 12737 | Link to NEW Imaris Open Page not working in 9.7 |
| 12741 | Cannot issue licenses because of an empty HostID even if Imaris has a valid MAC address |

© Oxford Instruments 2026