Imaris for Cell Biologists
View Product
 Part of the Oxford Instruments Group
Maté Biro, EMBL Australia Group Leader at The University of New South Wales, is leading a research team studying the behavior of cytotoxic T lymphocytes (CTLs). These immune cells move throughout the body searching for infected or damaged cells that need to be eliminated from the body. Because CTLs can also seek out and rid the body of cancer cells, they are being used as a type of immunotherapy for certain cancers. However, this type of treatment doesn’t work well on solid tumours because CTLs don’t infiltrate them sufficiently.
In a recent study, the researchers used Imaris to study how CTLs work together to attack a target. “We discovered that CTLs can directly engender a mass recruitment to an effector site without recourse to signals from the environment or other cell types,” Biro said. “They do this through a self-amplifying process termed swarming. Although more work is needed, it might one day be possible to exploit this mechanism to improve the efficiency of tumor-targeting immunotherapies.”
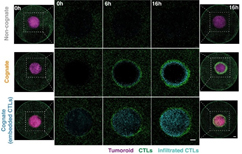
Figure 1 B from Paper, Associated Video
The researchers used Imaris to show that CTLs swarm as they attack tumor masses. These representative confocal images from three independent experiments show CTLs responding to a non-cognate EL4 tumouroid (top), a cognate antigen-presenting tumouroid comprising EL4 pulsed with SIINFEKL (middle) or a cognate tumouroid pre-embedded with tumour-reactive CTLs (bottom). Insets show the proportion of CTL infiltrates for each condition as indicated. Scale bars: 500 μm. Reprinted from eLife 2020;9:e56554 DOI: 10.7554/eLife.56554. CC BY 4.0.
To study population-wide movements and signals mediating CTLs, the researchers developed an ex vivo model that enabled them to study large-scale movements of primary CTLs around solid tumouroids embedded in 3D collagen matrices. They used the Imaris Surfaces function to segment cells in images with high spatiotemporal resolution. They then used tracking to determine a Forward Migration Index toward nearby tumouroids to investigate whether distal cells exposed to the chemokine signals migrate in a biased way towards the tumour mass.
“The rendering and visualisation options of Imaris are unsurpassed, and the number of useful rigorous, built-in quantitative tools keeps expanding every year,” said Biro. “For this study, the live cell tracking capabilities of Imaris, the ability to export positional data to Matlab and Python, and the ability to work with large datasets often in excess of 10 GB were all paramount.”
-20210706115355.png)
Figure 3 from Paper, Associated Video
Engagement of cognate tumouroid gives rise to a diffusing wave of chemoattraction. (A) Confocal images showing the distribution of CTLs (green) in relation to a SIINFEKL-pulsed EL4 cognate tumouroid at 0 and 2 hr. Pseudocolour: distance to nearest cell in µm. (B) Cumulative distribution function (CDF) of nearest distances of CTLs to a cognate tumouroid at 0 hr and 2 hr. Insert shows the corresponding probability density function (PDF), where dashed lines are linear fits. (C) Randomly selected representative tracks of CTLs migrating towards a non-cognate (top) or cognate (bottom) tumouroid with pre-embedded tumour-reactive CTLs (located towards -X); outset of all tracks centred on origin. (D) Angular histograms of CTL track displacements. 0°: away from tumour, 180°: towards tumour. Data pooled from three independent experiments (n = 4947 for non-cognate; top, n = 3926 tracks for cognate; bottom). (E) Kymographs of instantaneous FMI (based on displacement vector at each timeframe) for data shown in (D). Reprinted from eLife 2020;9:e56554 DOI: 10.7554/eLife.56554. CC BY 4.0.
Some of the imaging datasets had lower temporal resolution but covered very large fields of view that were on the scale of several millimeters rather than the typical tens or hundreds of microns. For these data, it wasn’t possible to track individual cells, so the researchers used the Imaris Spots function to assign a spot to each cell and then recorded the positions of these spots with respect to tumouroids. This information was fed into a novel statistical framework that allowed them to determine whether an underlying swarming phenomenon was present in the progressive changes in cell densities.
“We also devised a new metric, called the swarming metric,” said Biro. “This scale goes from -1 for perfect anti-swarming, where all the cells are dispersed as far from the focus zone as possible, to 0 for perfectly random distribution and on to 1 for perfect swarming, where all cells are localised within the focus zone.”
Overall, the study showed that differentiated CTLs that are actively scanning for targets in peripheral tissues can rapidly respond to threats such as infected or transformed cells by signalling to one another. This causes other CTLs that are some distance away to migrate towards the threat in a rapid and directional manner.
The researchers are continuing to carry out various studies using Imaris visualization and analysis to learn more about CTL behavior and to investigate ways to harness the CTLs’ natural signals for use in targeting solid tumors.

© Oxford Instruments 2026